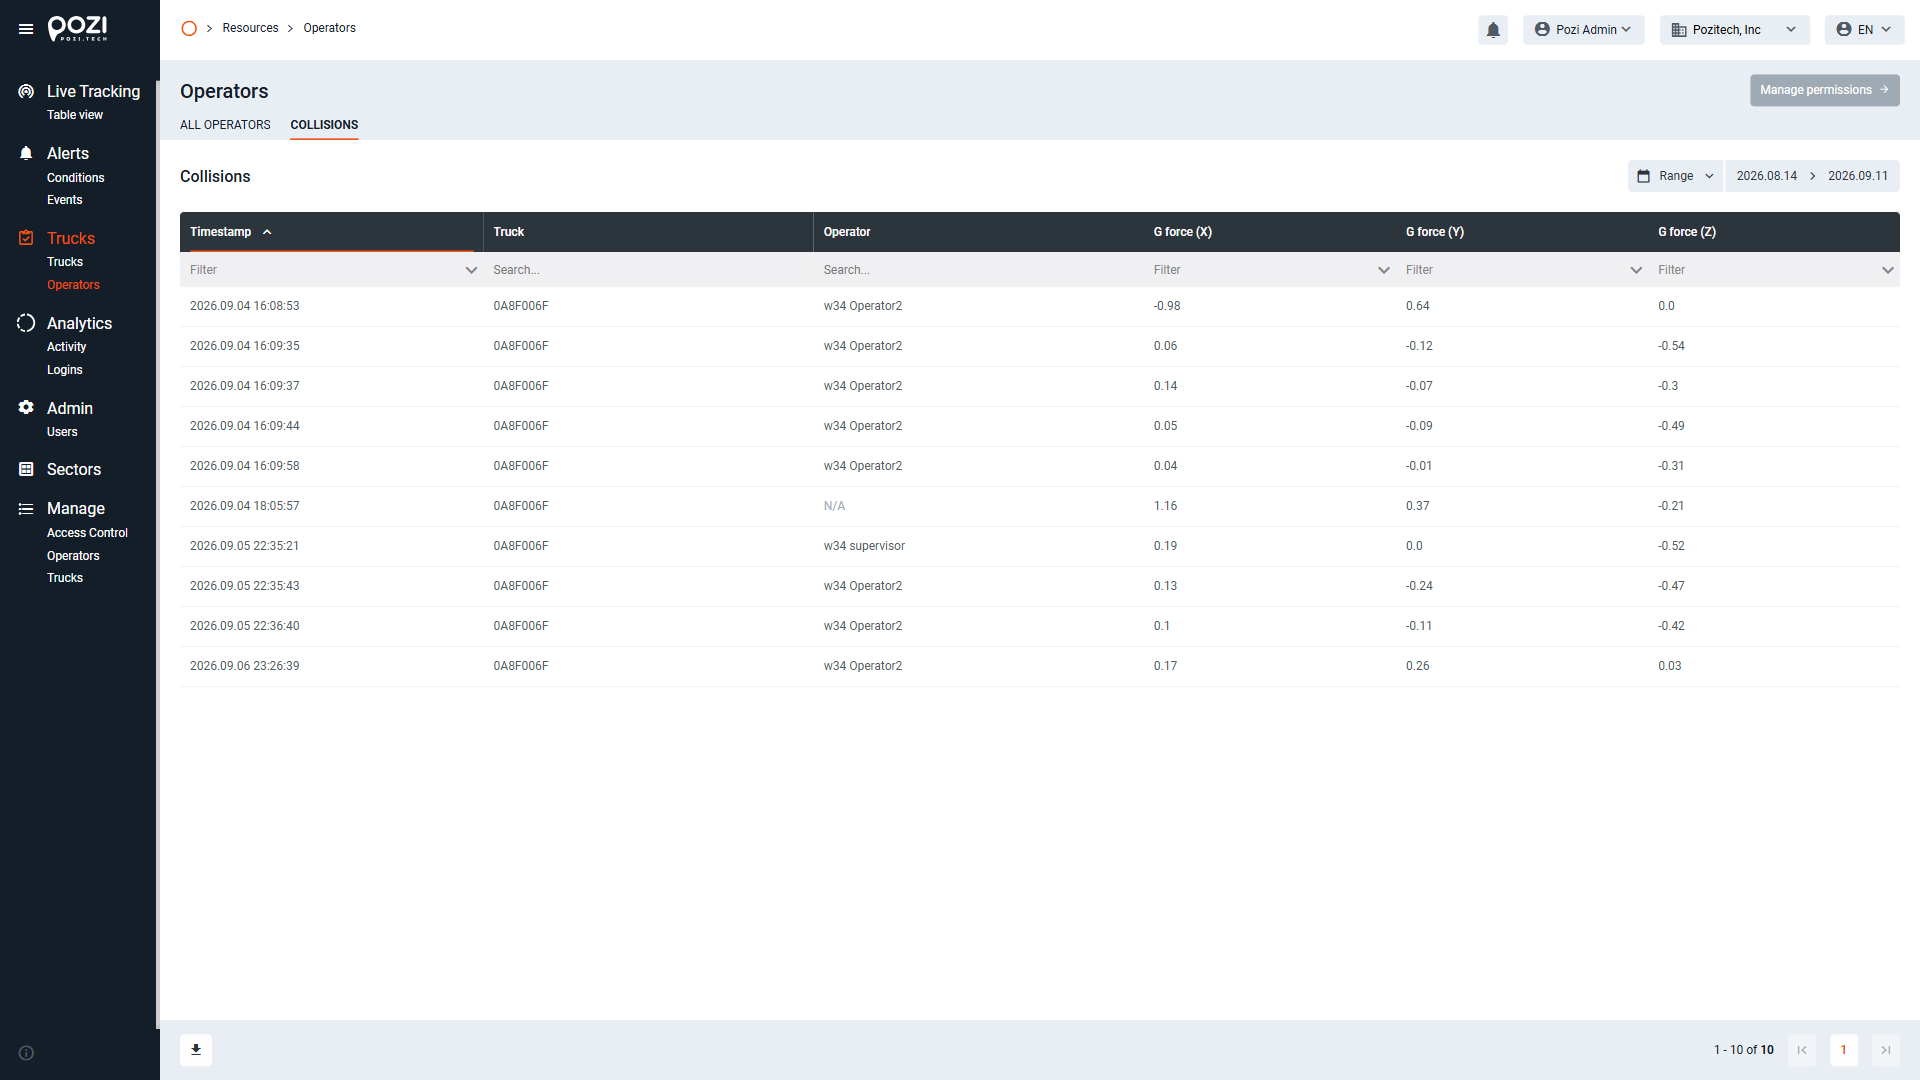
The Trucks menu in the SmarTruck system provides detailed information on trucks and their operators, covering all relevant parameters. This menu contains two main submenus: Trucks and Operators.
Trucks
Trucks Submenu
By default, the system opens the Trucks submenu, which consists of six pages:
- All Trucks
- Activity Timeline
- Utilization Timeline
- Utilization History
- Maintenance
- Issue Reports
- Collisions
- Inspections
The default page is All Trucks.
All Trucks
This page displays truck utilization data, along with basic vehicle information.
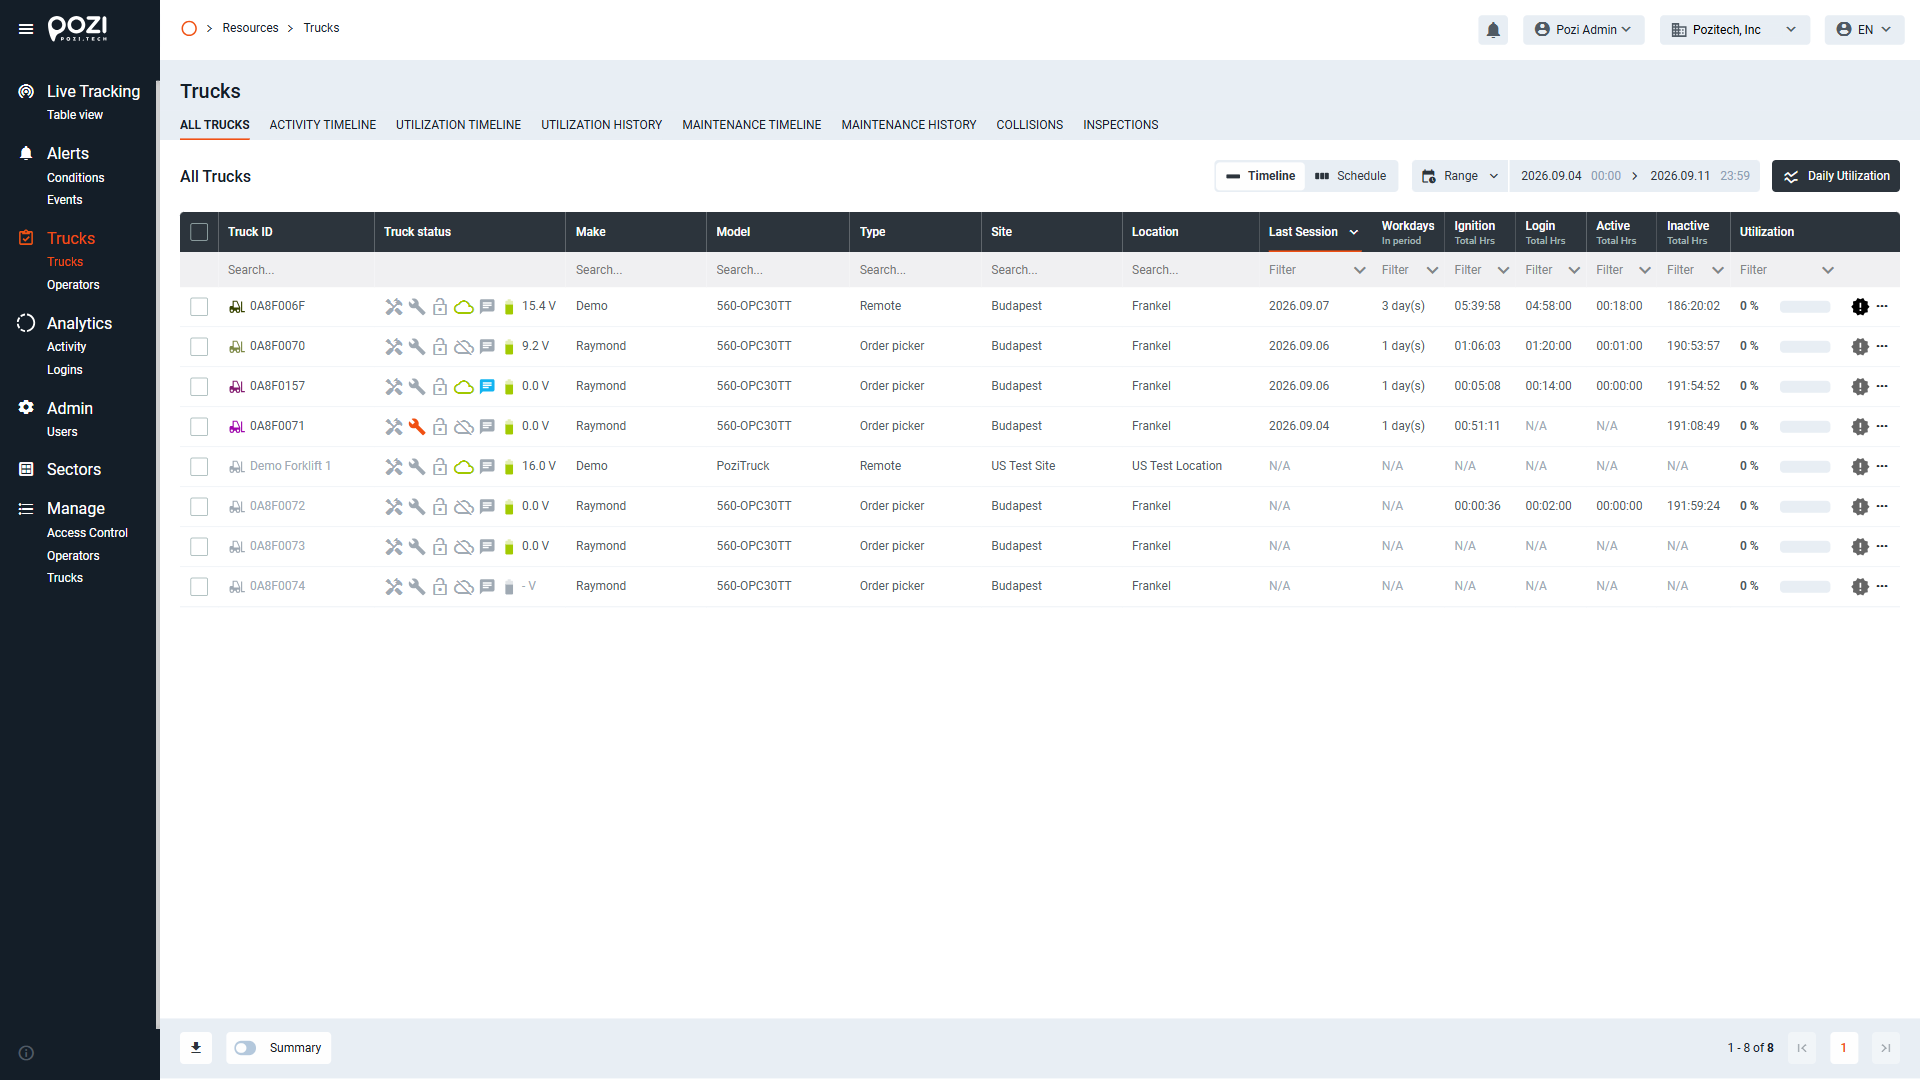
Selecting Trucks
- To select a truck, click the truck’s name or the … icon at the end of the row and choose Dashboard from the dropdown menu.
- You can also select multiple trucks by clicking the checkboxes at the beginning of each row.
Dashboard
- The Dashboard provides a graphical overview of the selected truck’s utilization data.
- Use the date selector in the top-right corner to filter data by date range.

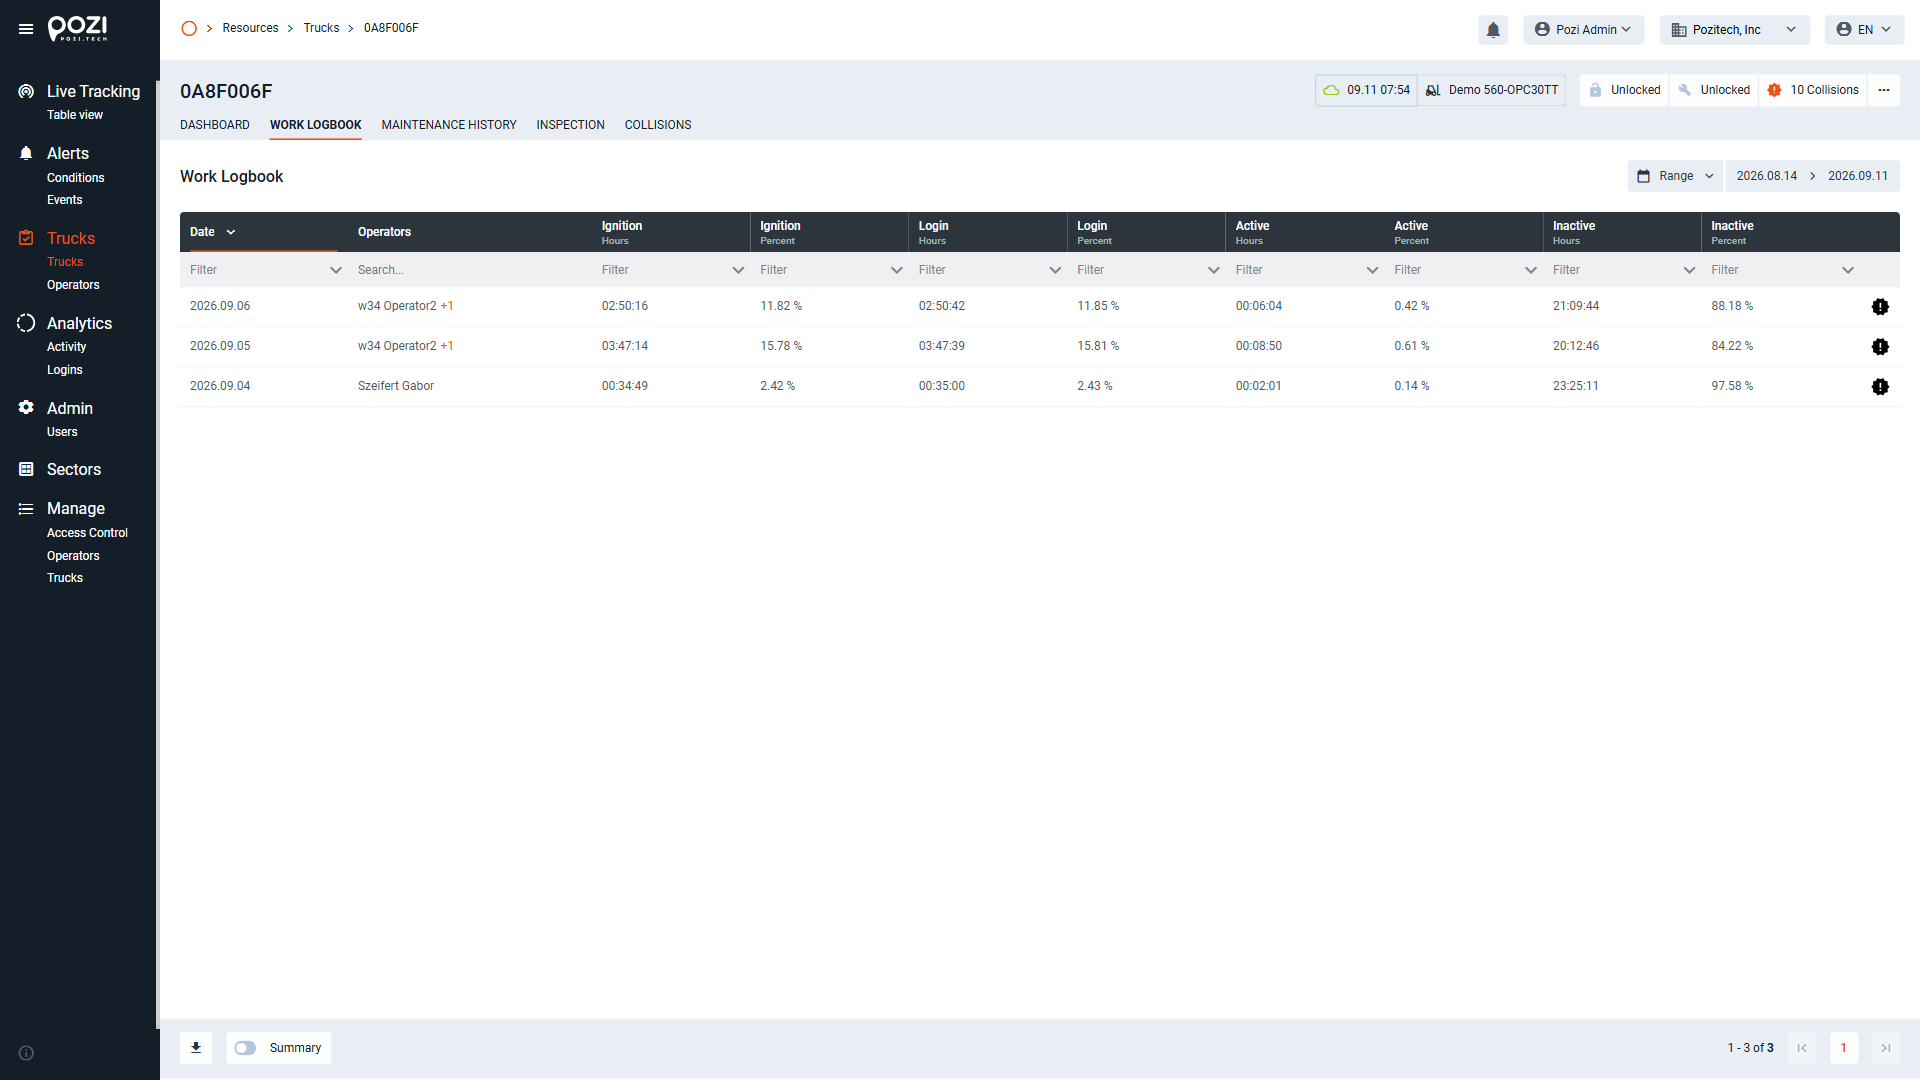
Work Logbook
- Displays shift-based utilization data for a selected truck, including:
- Total operating time
- Movement time
- Idle time
- The logbook also shows the name of the operator logged into the truck during each shift.
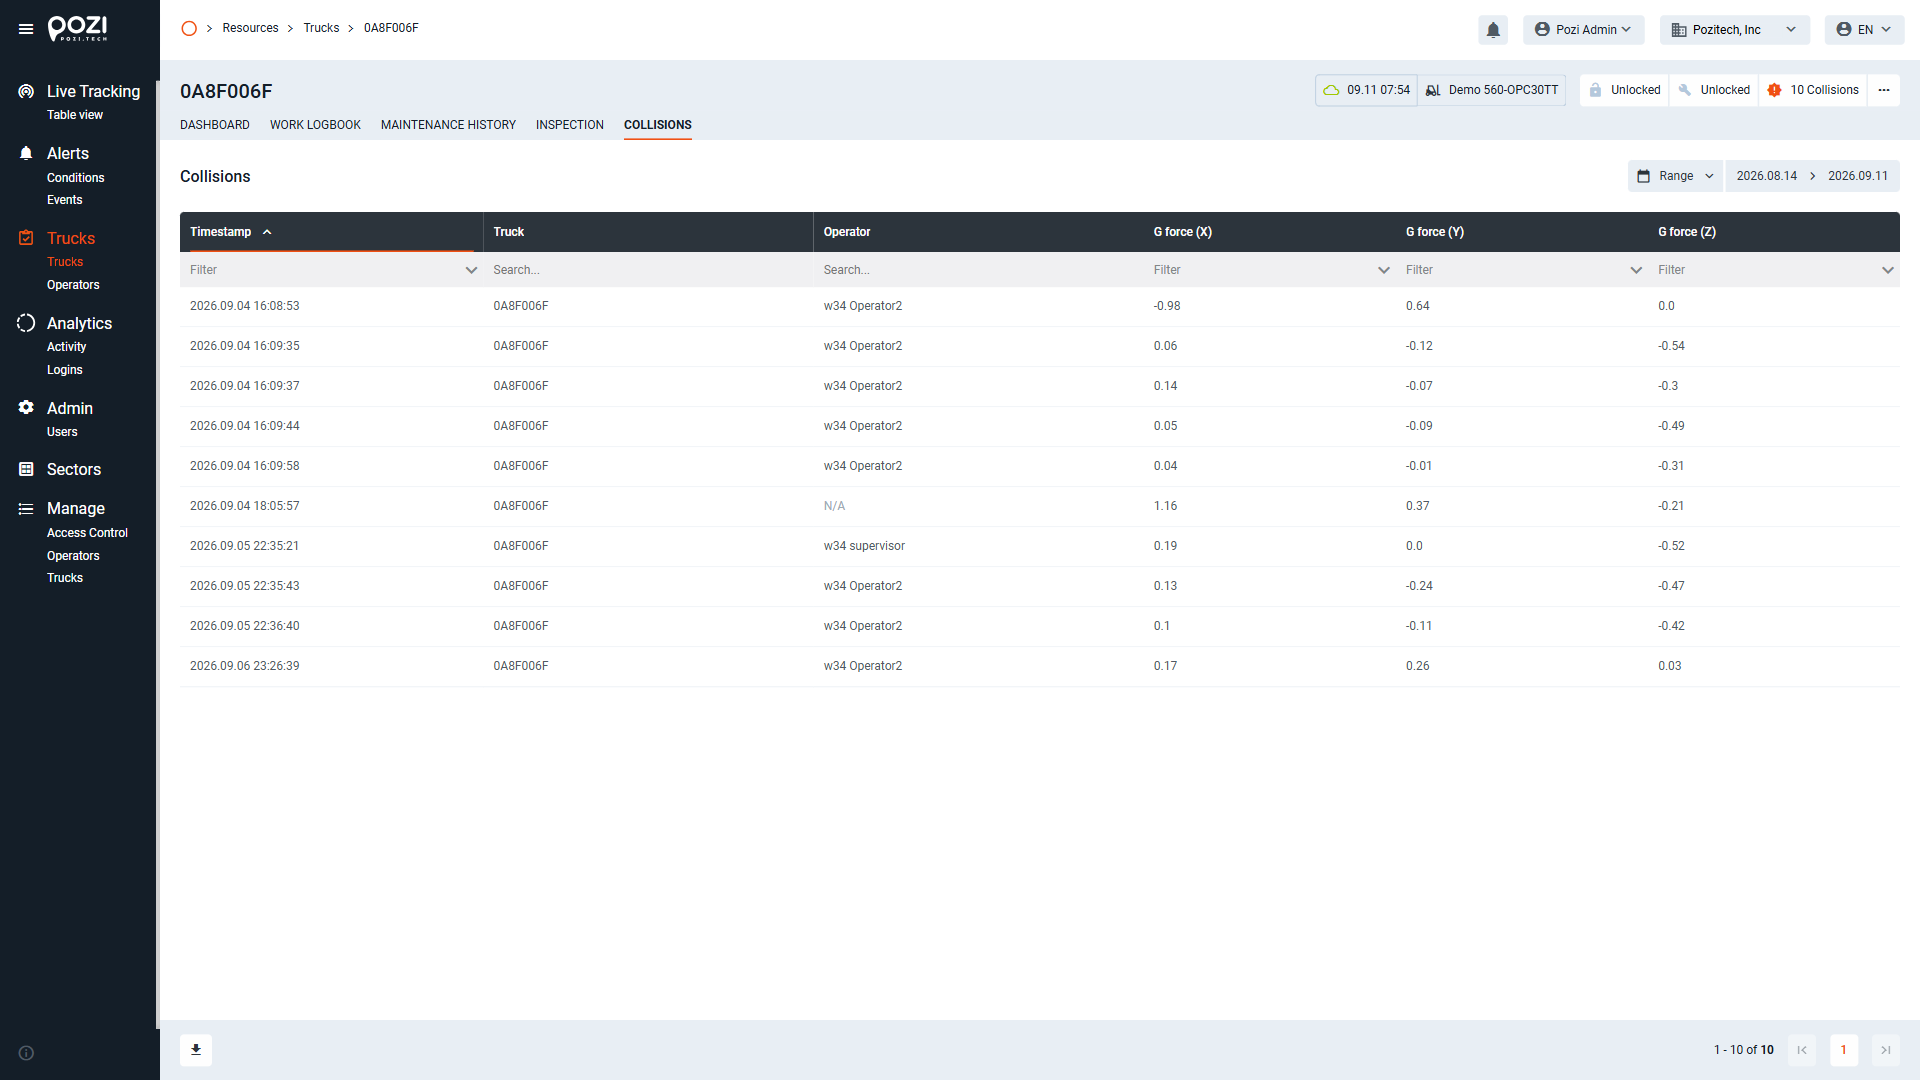
Collisions
- Lists collision events detected by the truck’s sensors, including timestamps and impact data. The name of the logged-in operator is also displayed.
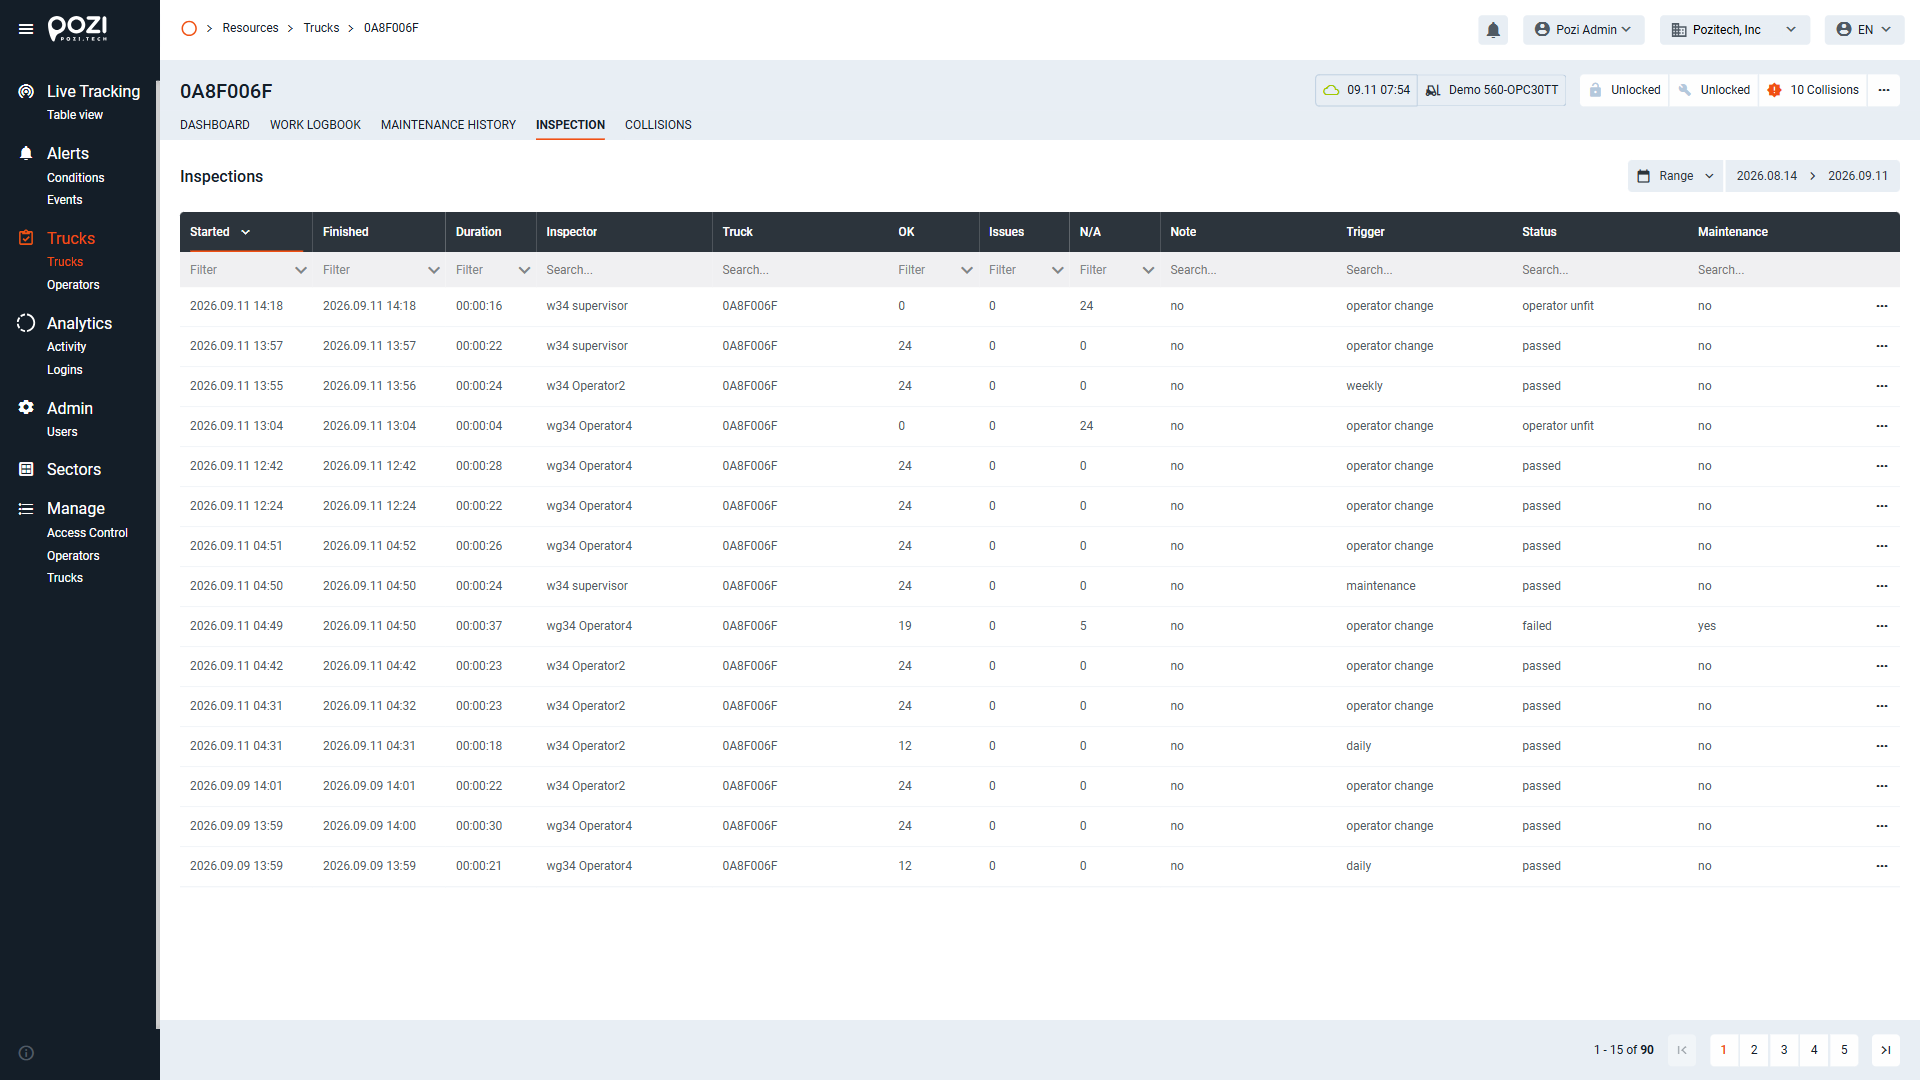
Inspections
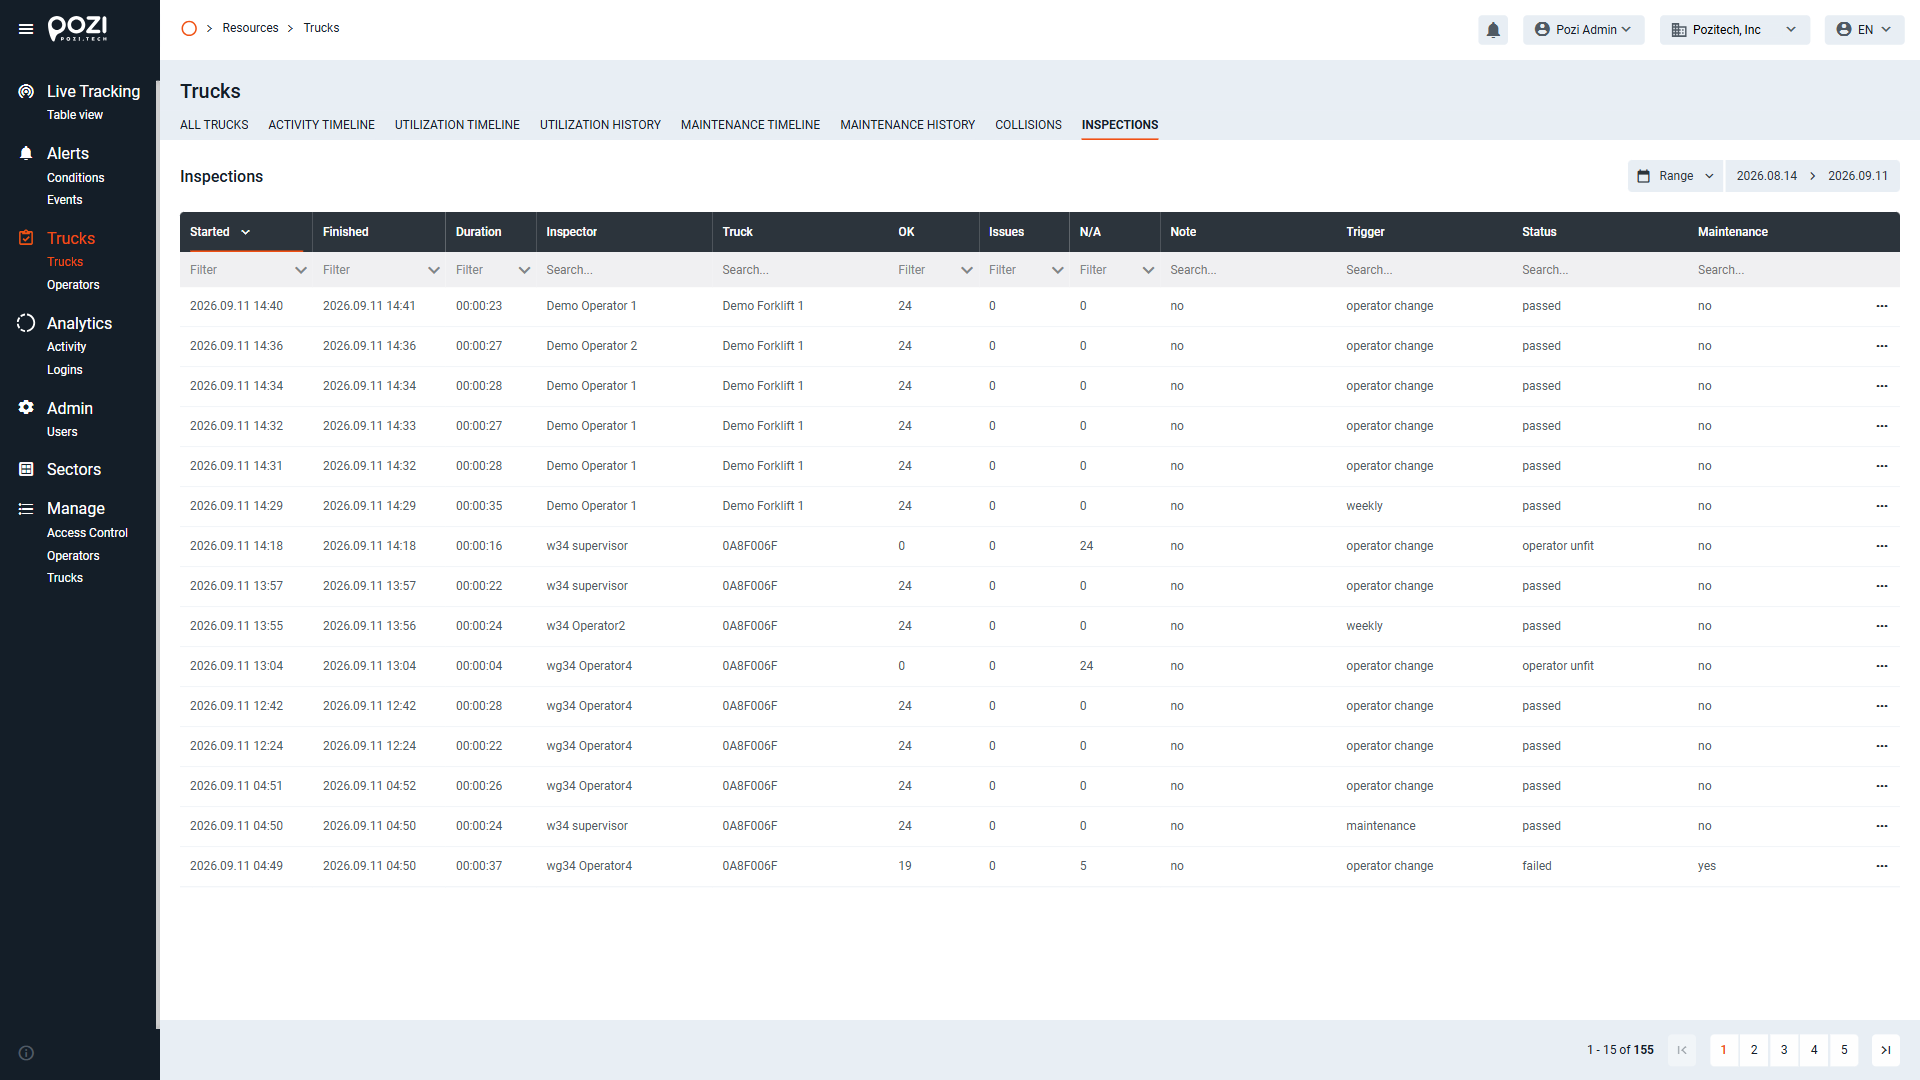
- Lists inspection events detected by the truck’s sensors, including timestamps, status of inspection, the duration, the type of the inspection, the score the inspector received on the inspection test, and the final result. The name of the logged-in operator is also displayed.
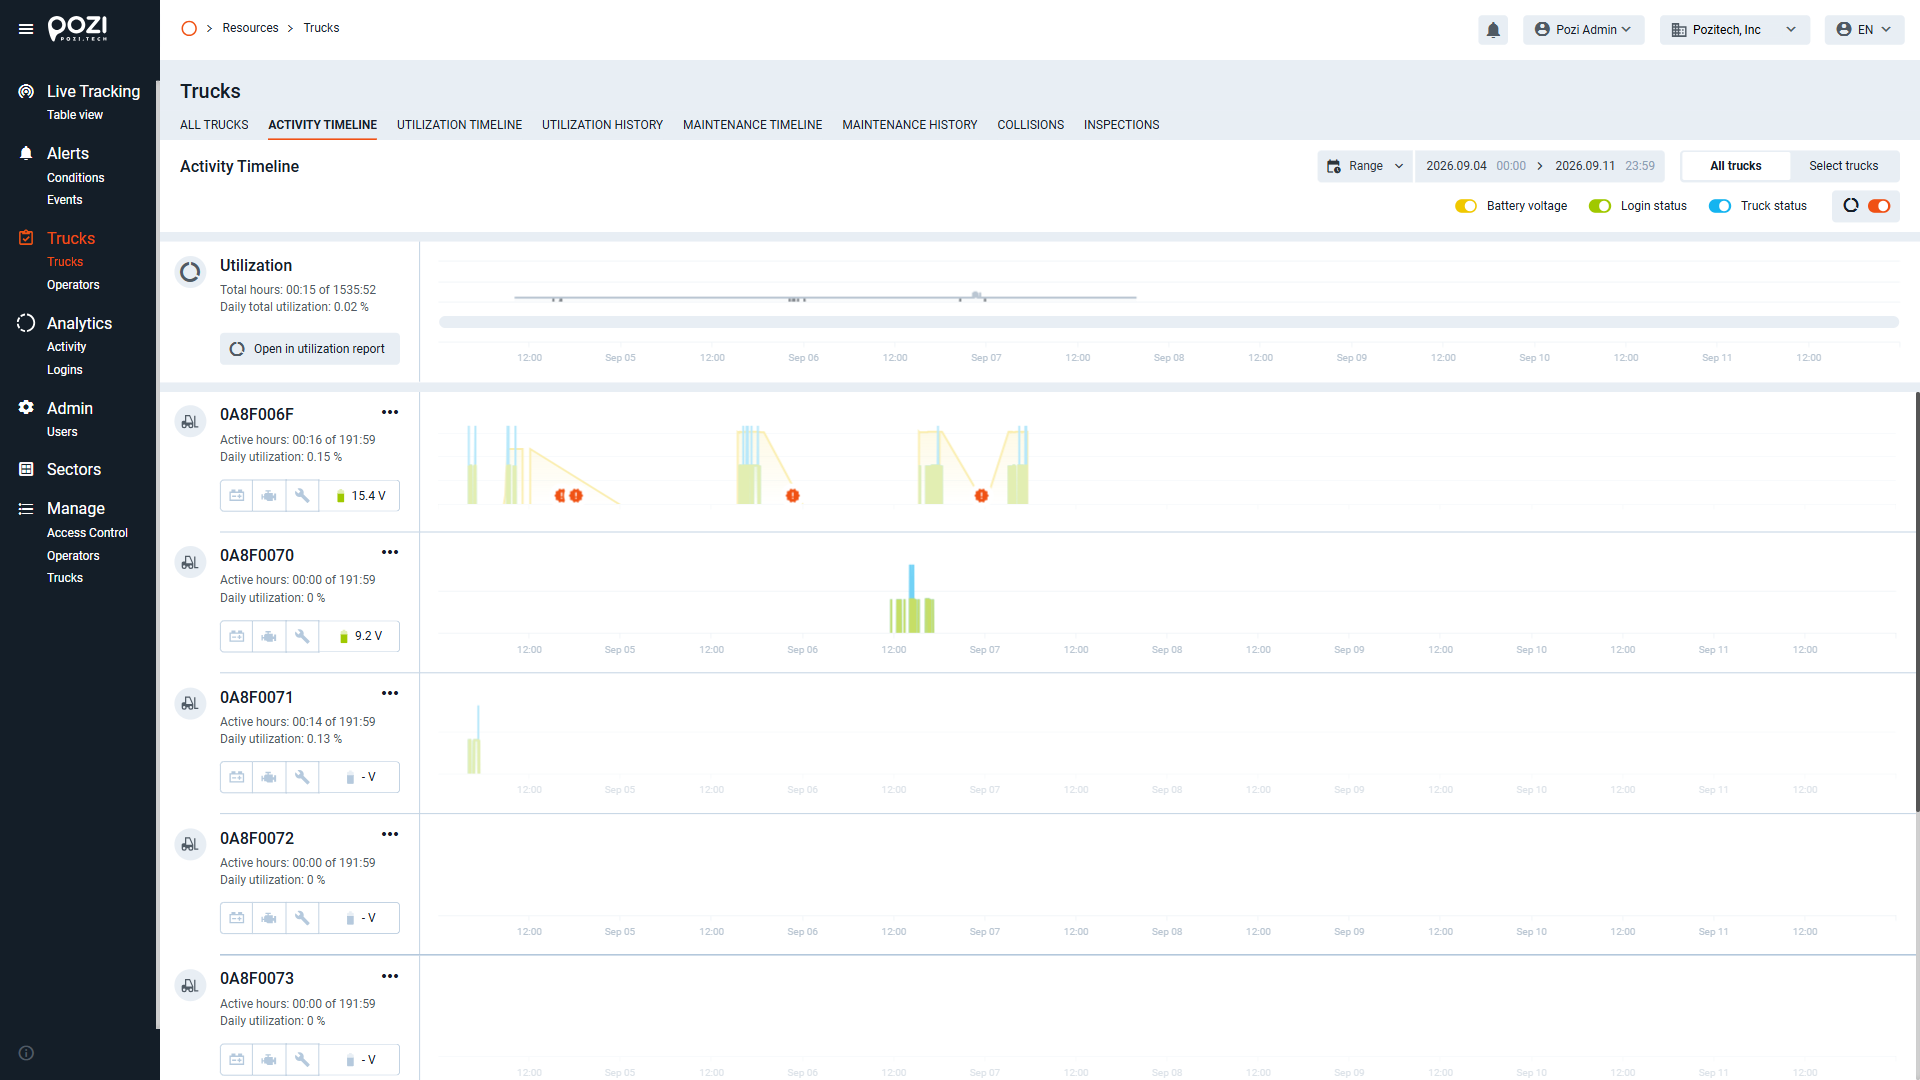
Activity Timeline
This page visualizes truck utilization over time, showing:
- Login status
- Movement status
- Battery voltage
Click the … icon next to a truck’s name to open a submenu with options to access the Dashboard, Work Logbook, or Access Control for that truck.
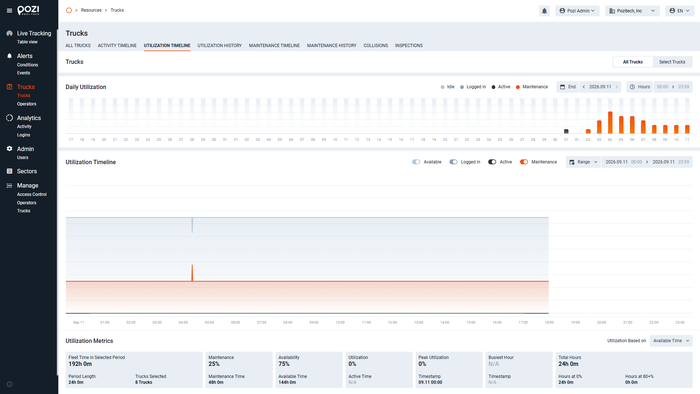
Daily Utilization
Displays truck utilization over a timeline, either for all trucks or for individually selected ones. You can customize the timeline to display data the following way: choose the End Date (default is the current day) and the Hours of that end date if you do not want to include the whole day. The diagram always shows 8 weeks of data, with the days indicated at the bottom.
Daily utilization includes 4 states: Idle, Active, Maintenance, and Logged In
In addition to that the screen also includes utilization information in the form of a diagram for all trucks. You can similarly customize the timeline by giving a time range with start/end dates and specific hour of those dates. Below the diagram can be found the chosen timeline’s metrics. Utilization can calculated based on:
- Available Time: default setting, utilization = active time / available time
- Fleet Time: utilization = active time / fleet time
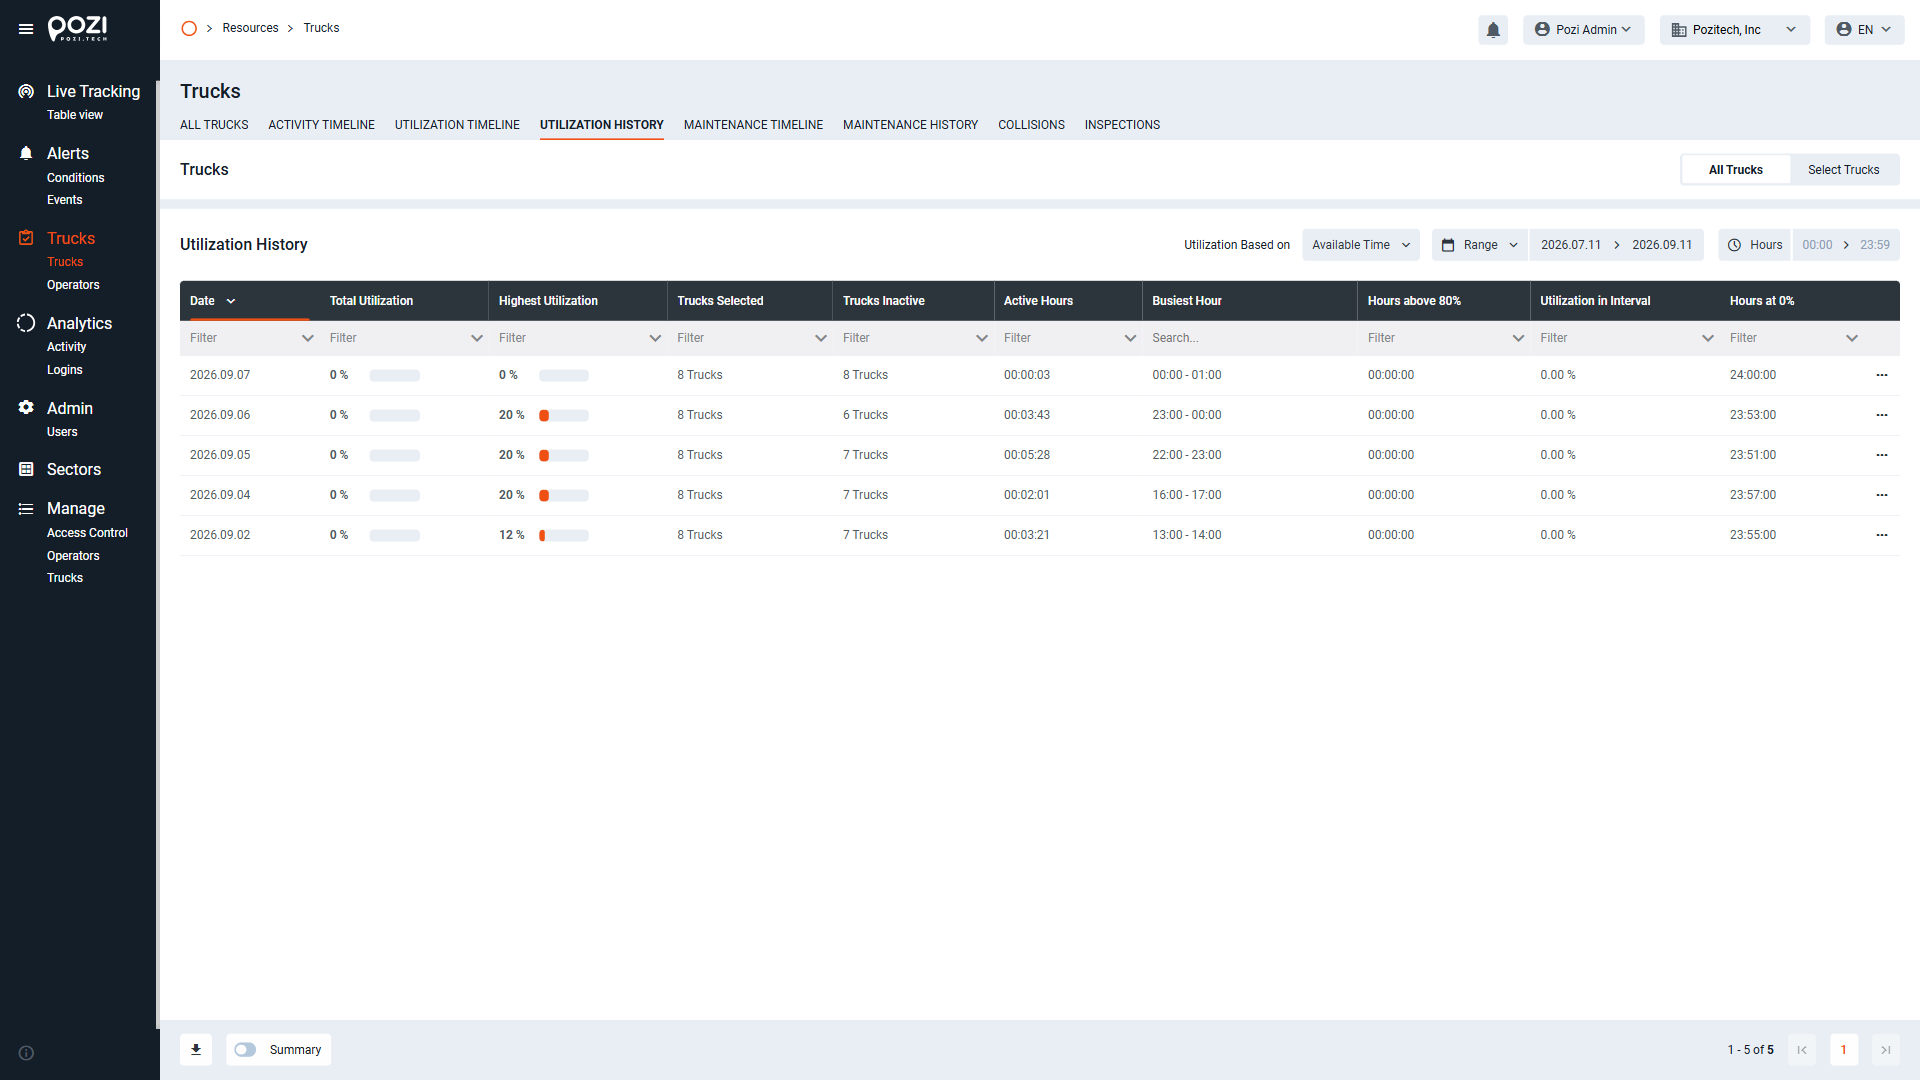
Utilization History
This tabular view presents utilization and maintenance data sorted by calendar days. Use the filters to customize the displayed data as needed. Similarly to Utilization Timeline, a time period selector is also shown giving an option to see data based on specific dates and hours.
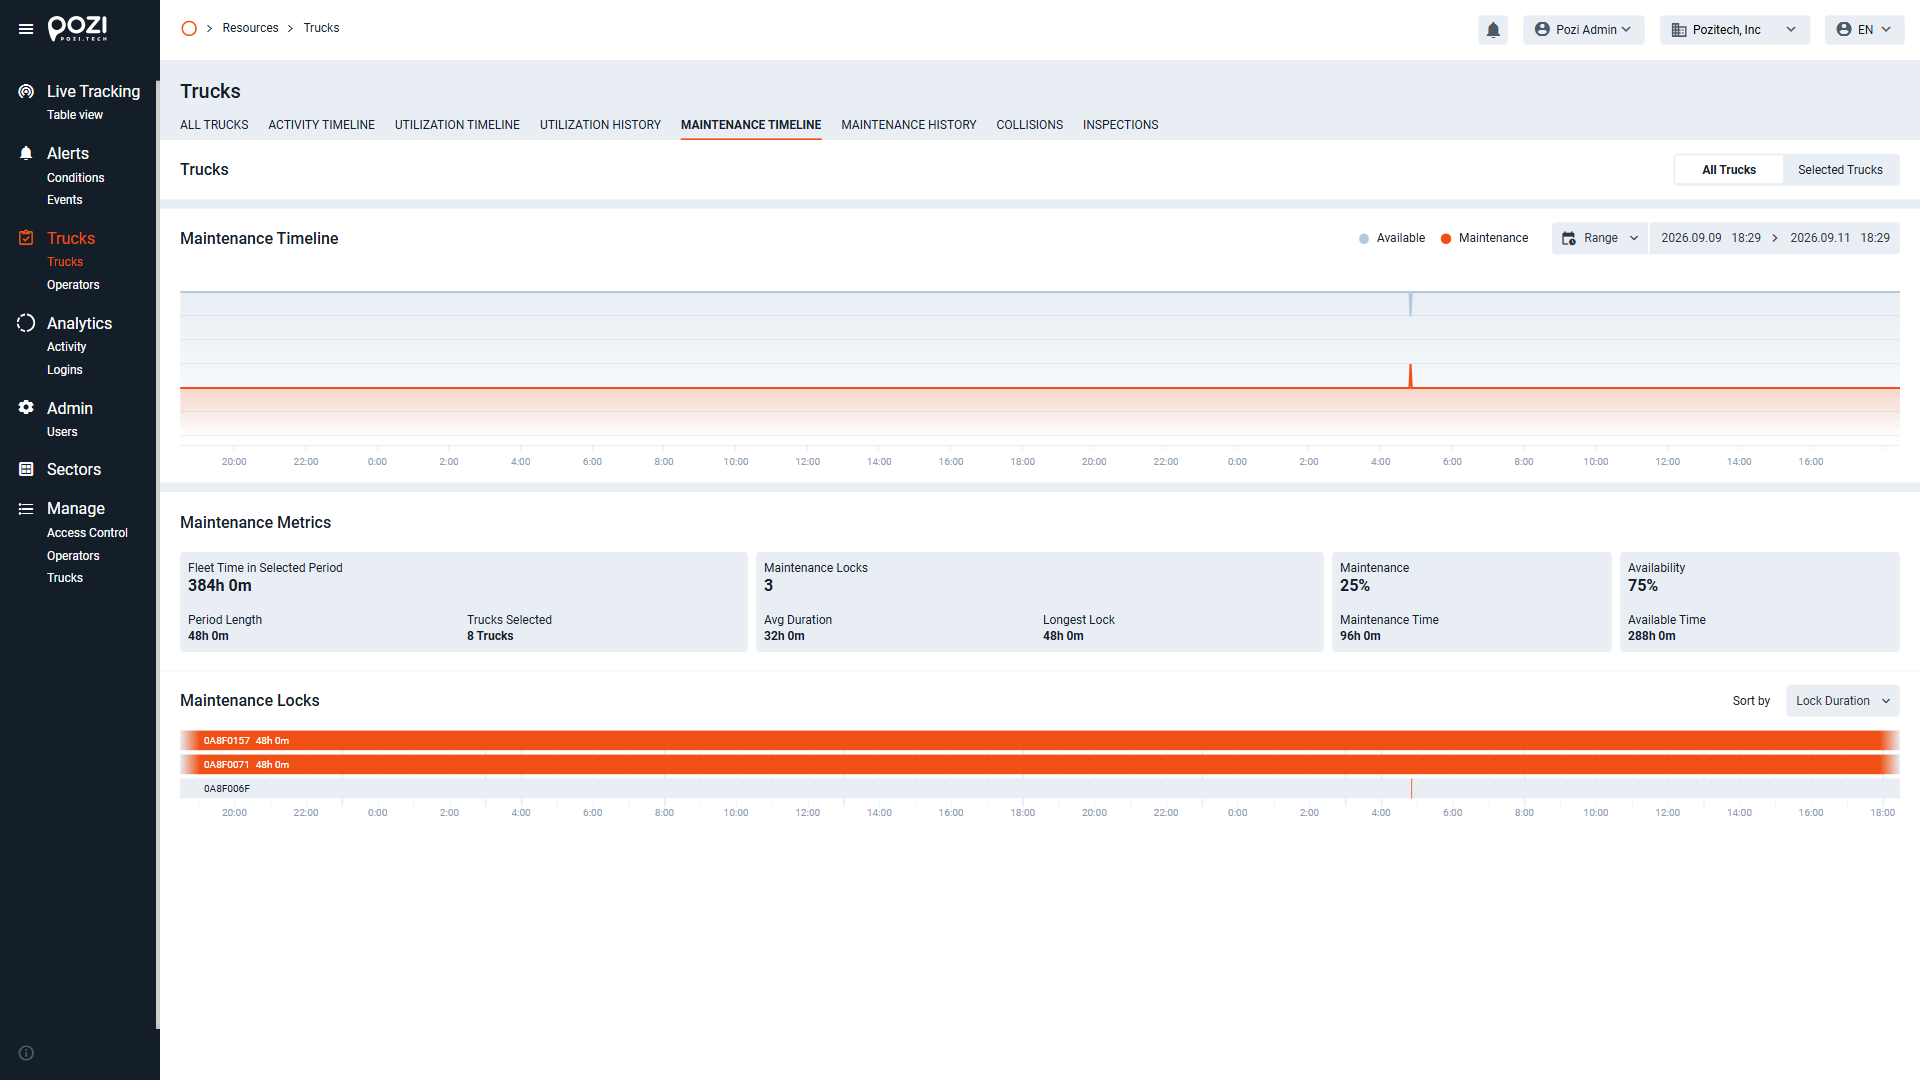
Maintenance Timeline
The Maintenance Timeline tab provides information just regarding the maintenance information and status. You can customize this timeline just the same way as the Utilization Timeline by giving a period you are interested in. The maintenance metrics display more in-depth information such as the amount of maintenance locks and the duration of the lock, while also showing the usual availability percentage. Lastly, this screen includes the exact time and truck name when a truck was placed under a maintenance lock, providing a clear view of all the trucks that has been under a maintenance lock within the time period chosen.
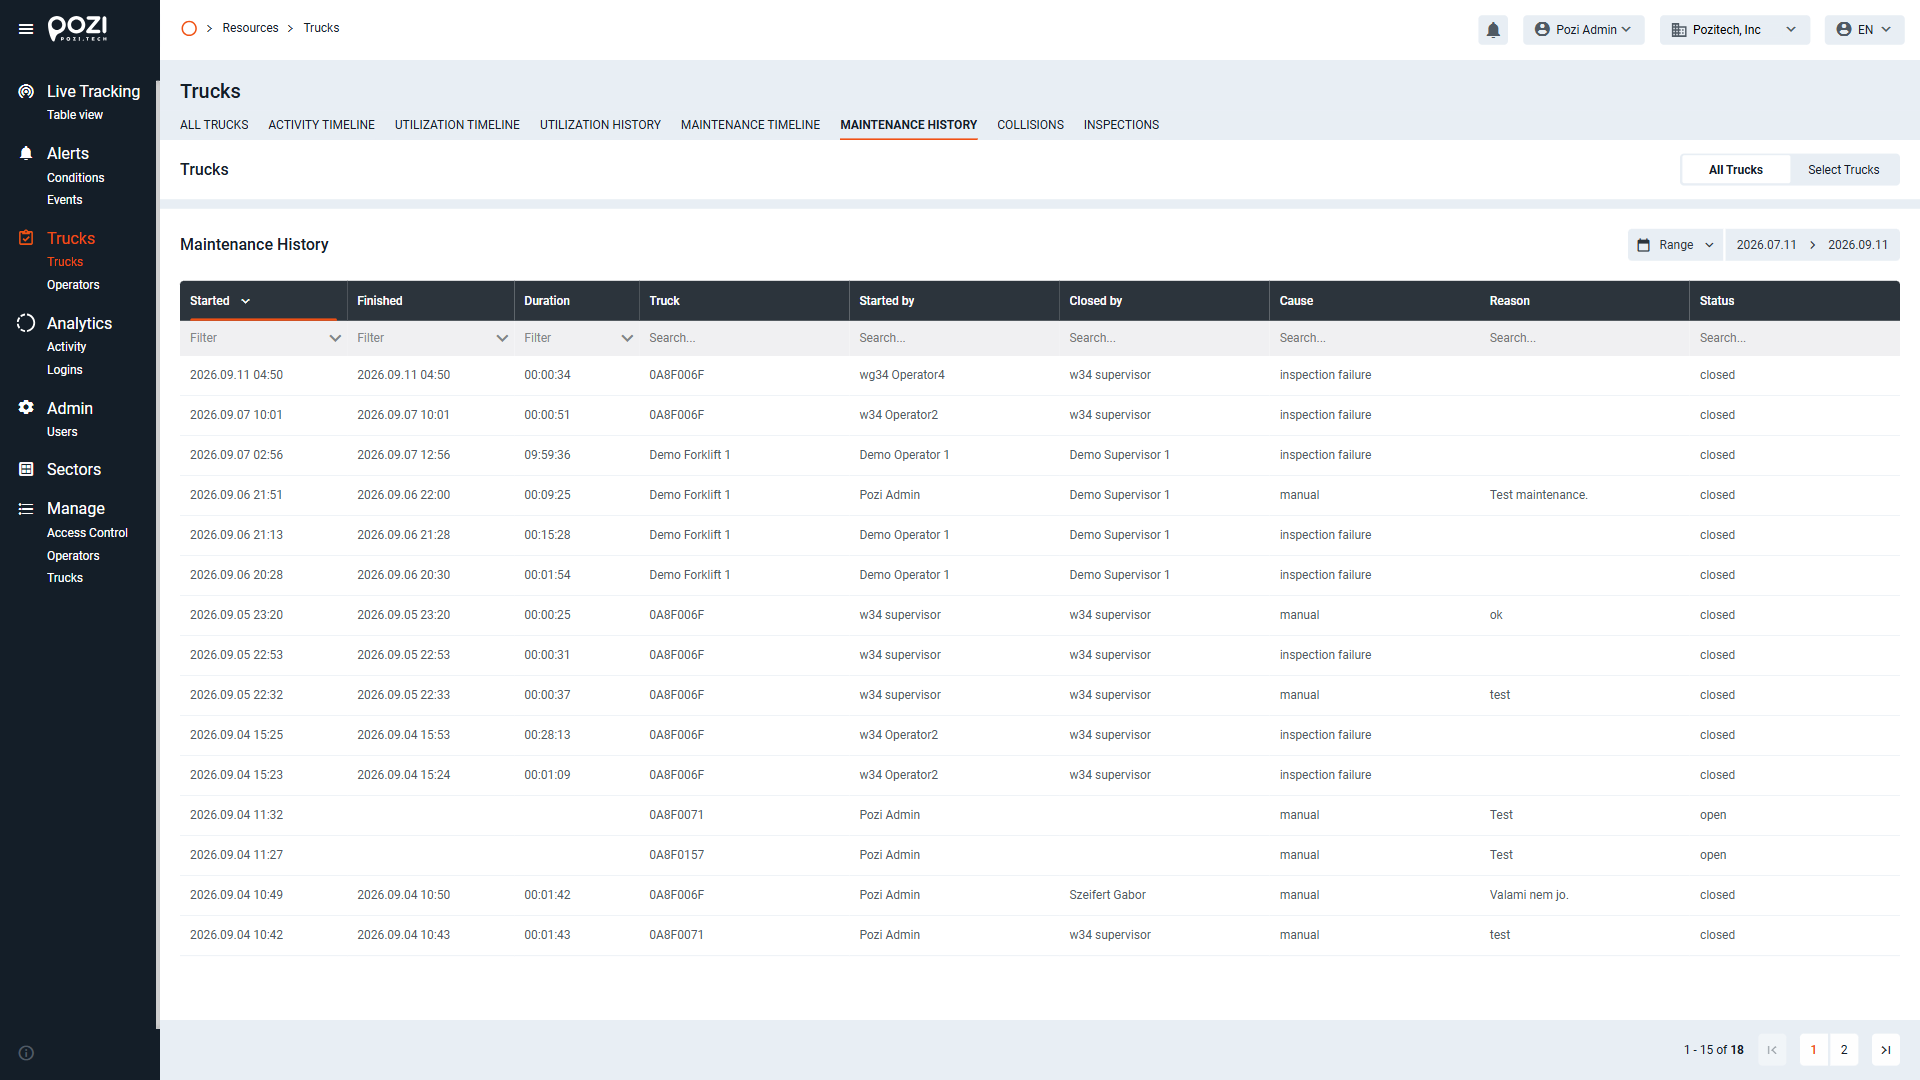
Maintenance History
The Maintenance History tab works in a similar manner to the Utilization History tab but represents more information about the status of each maintenance lock for each truck. The status, truck name, time and person who set the first lock, source of the lock, number of reports, and more are displayed. The reports include all reports associated with that truck while it was under a lock.
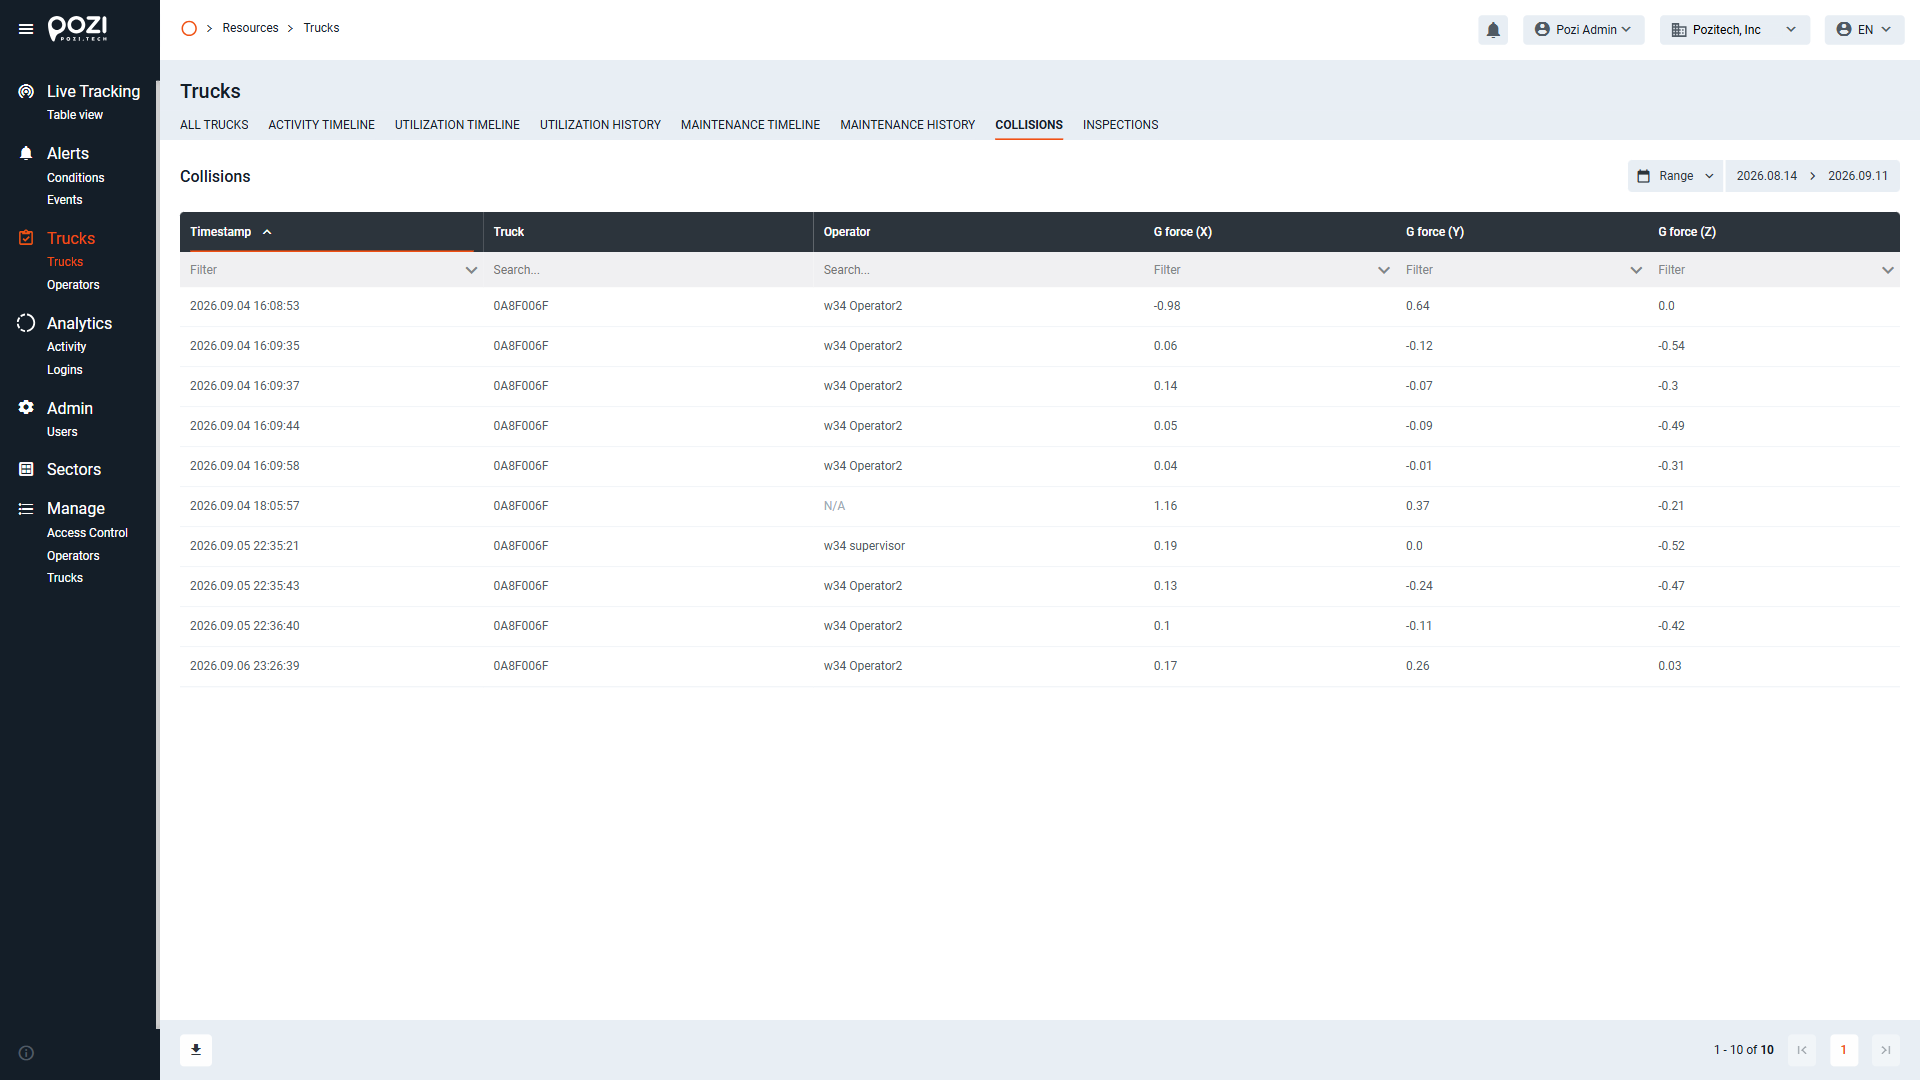
Collisions
Shows all detected collision events, sorted by timestamp. Like other tables in the SmarTruck system, this one is fully searchable and filterable.
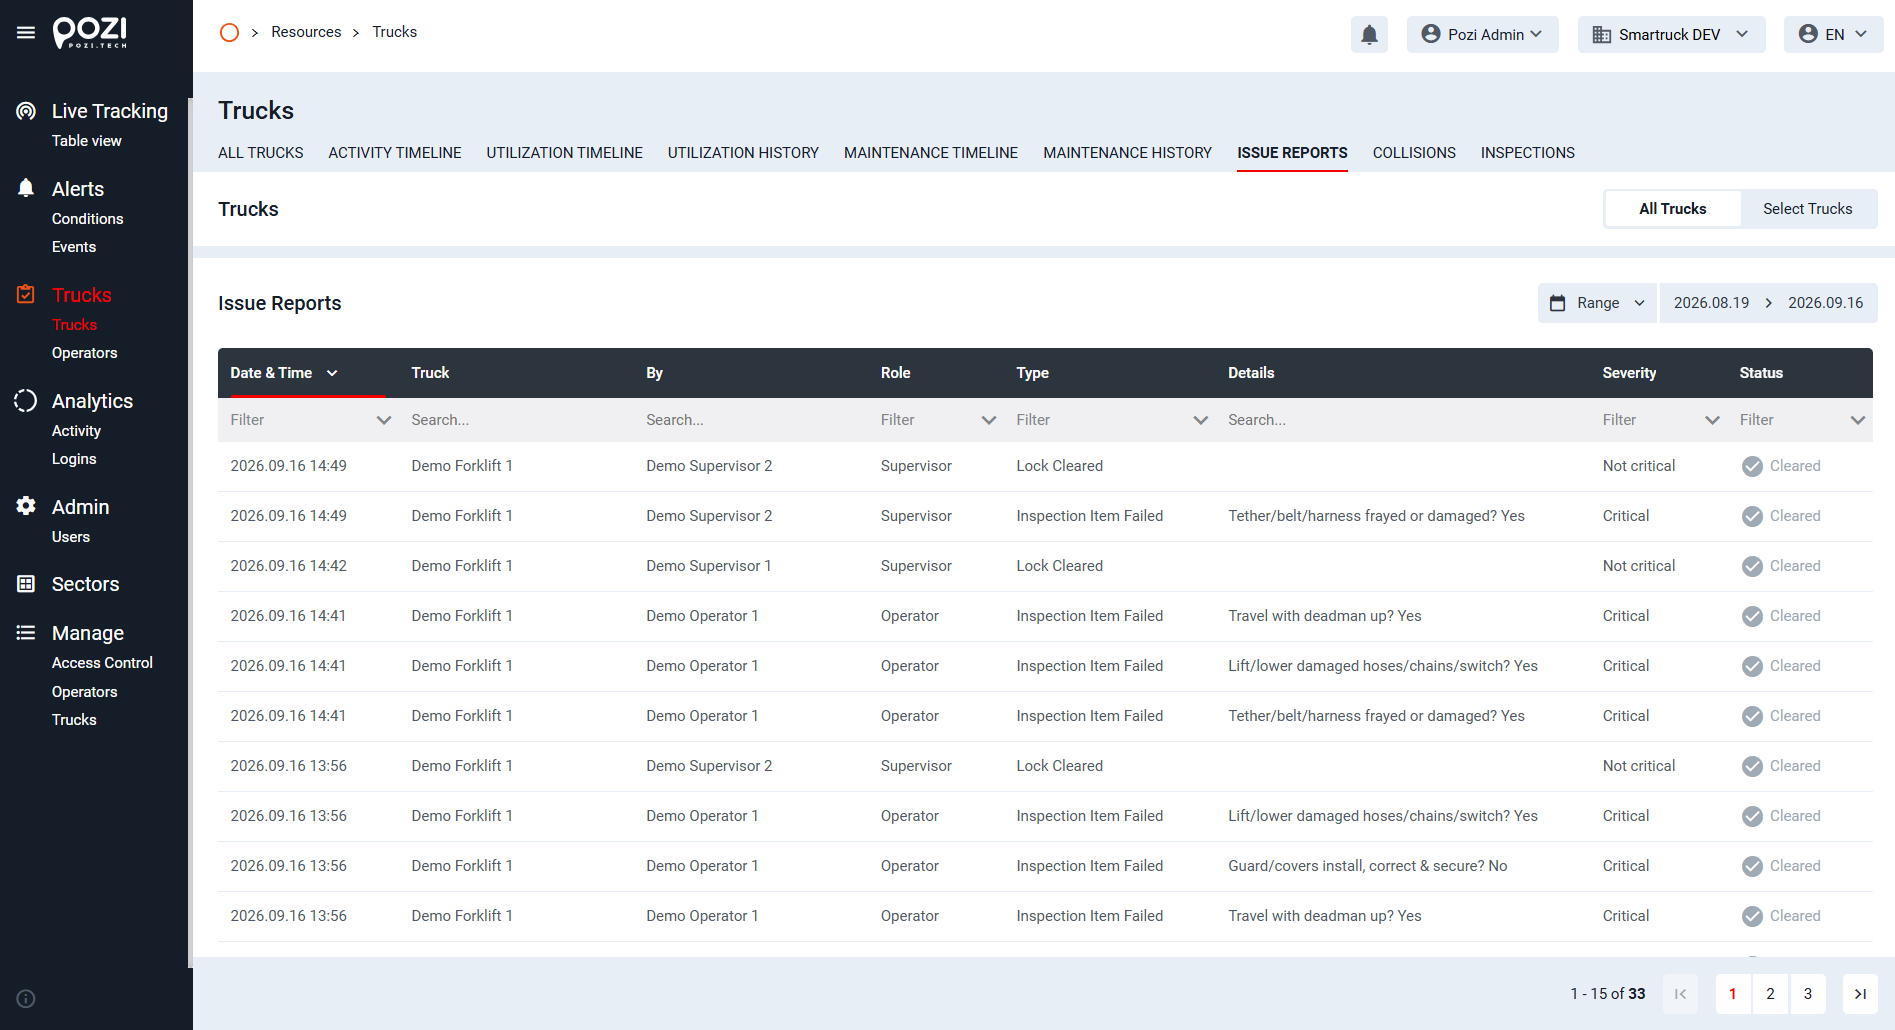
Issue reports
Shows the history of when the maintenance lock was cleared and the reports generated when an operator filled out a Safety Inspection and failed it, sorted by timestamp. Like other tables in the SmarTruck system, this one is fully searchable and filterable.
Inspections
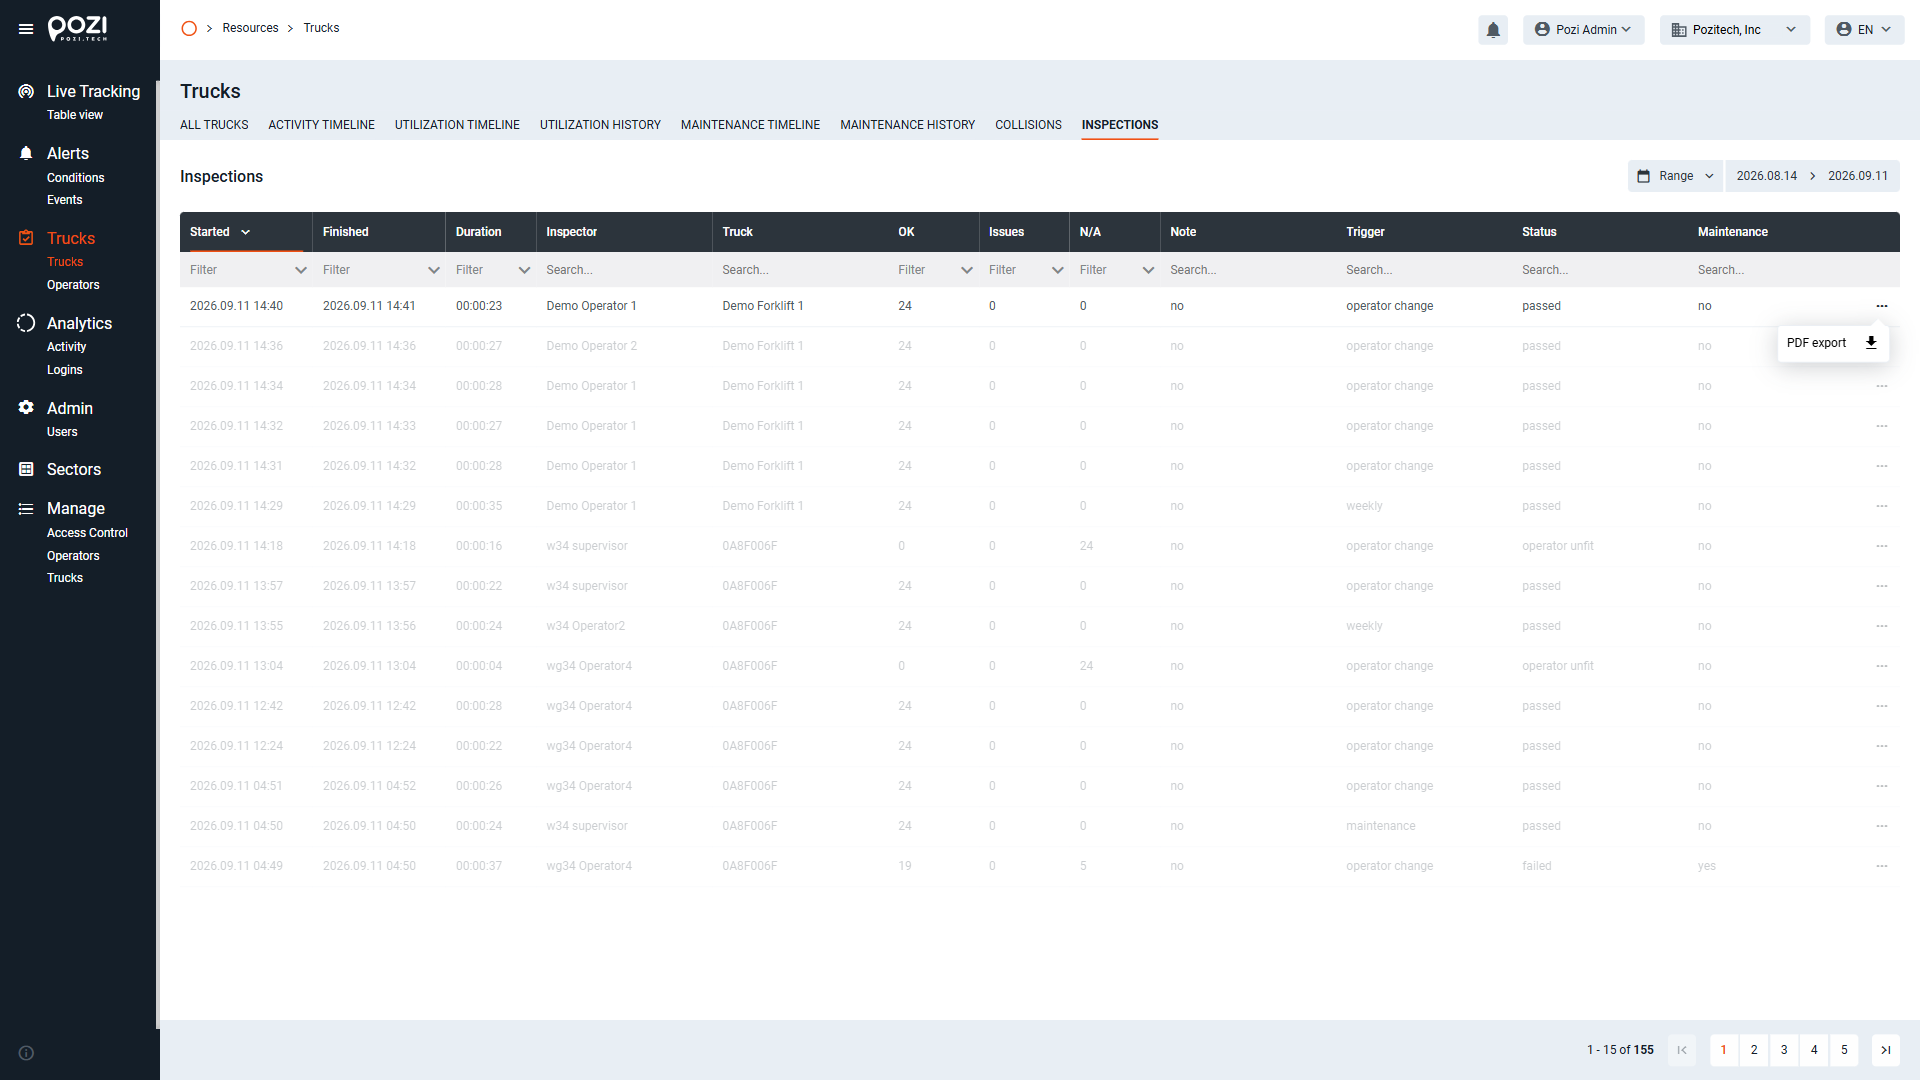
The Inspection Tab is designed to show all inspections the chosen truck went under and the status/results of that inspection. In addition, by clicking the “…” (three-dot) button on the right side of an inspection line, the inspection can be PDF exported.
Templates
The Trucks menu allows the use of templates, which can be especially useful when managing a large truck fleet and needing to regularly extract data from selected trucks. With templates, you can easily load a pre-defined set of trucks, streamlining data retrieval.
Templates can be created and used in the following views: Activity Timeline, Daily Utilization, and Utilization History. All three views include a toolbar at the top for managing templates.
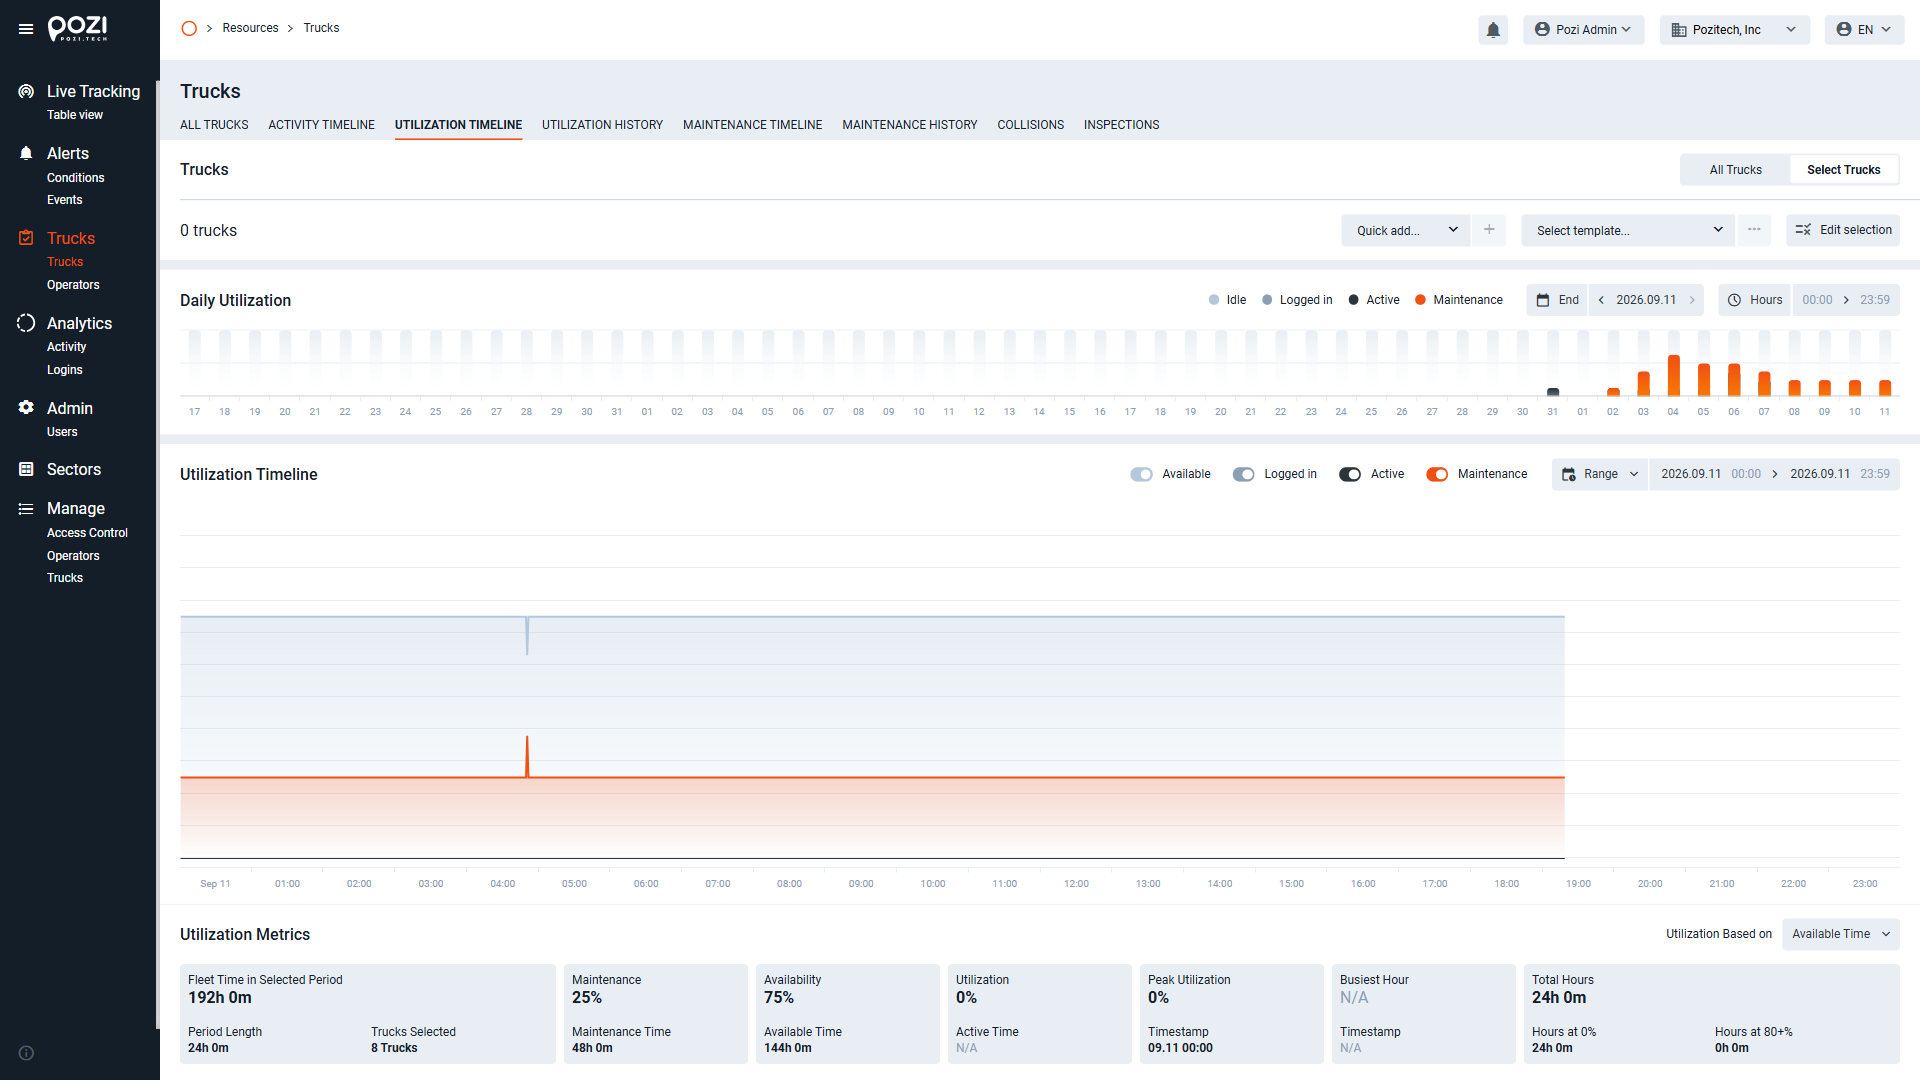
The template management toolbar offers the following options (in order to see the following steps choose “Select Trucks” in the top-right corner):
- Quick Add: Add trucks to the list one by one.
- Select Template: Load an existing template. You can also click the “…” icon next to it to open a drop-down menu and select the New Template option.
- Edit Selection: Choose trucks by selecting checkboxes from the “All Trucks” table.
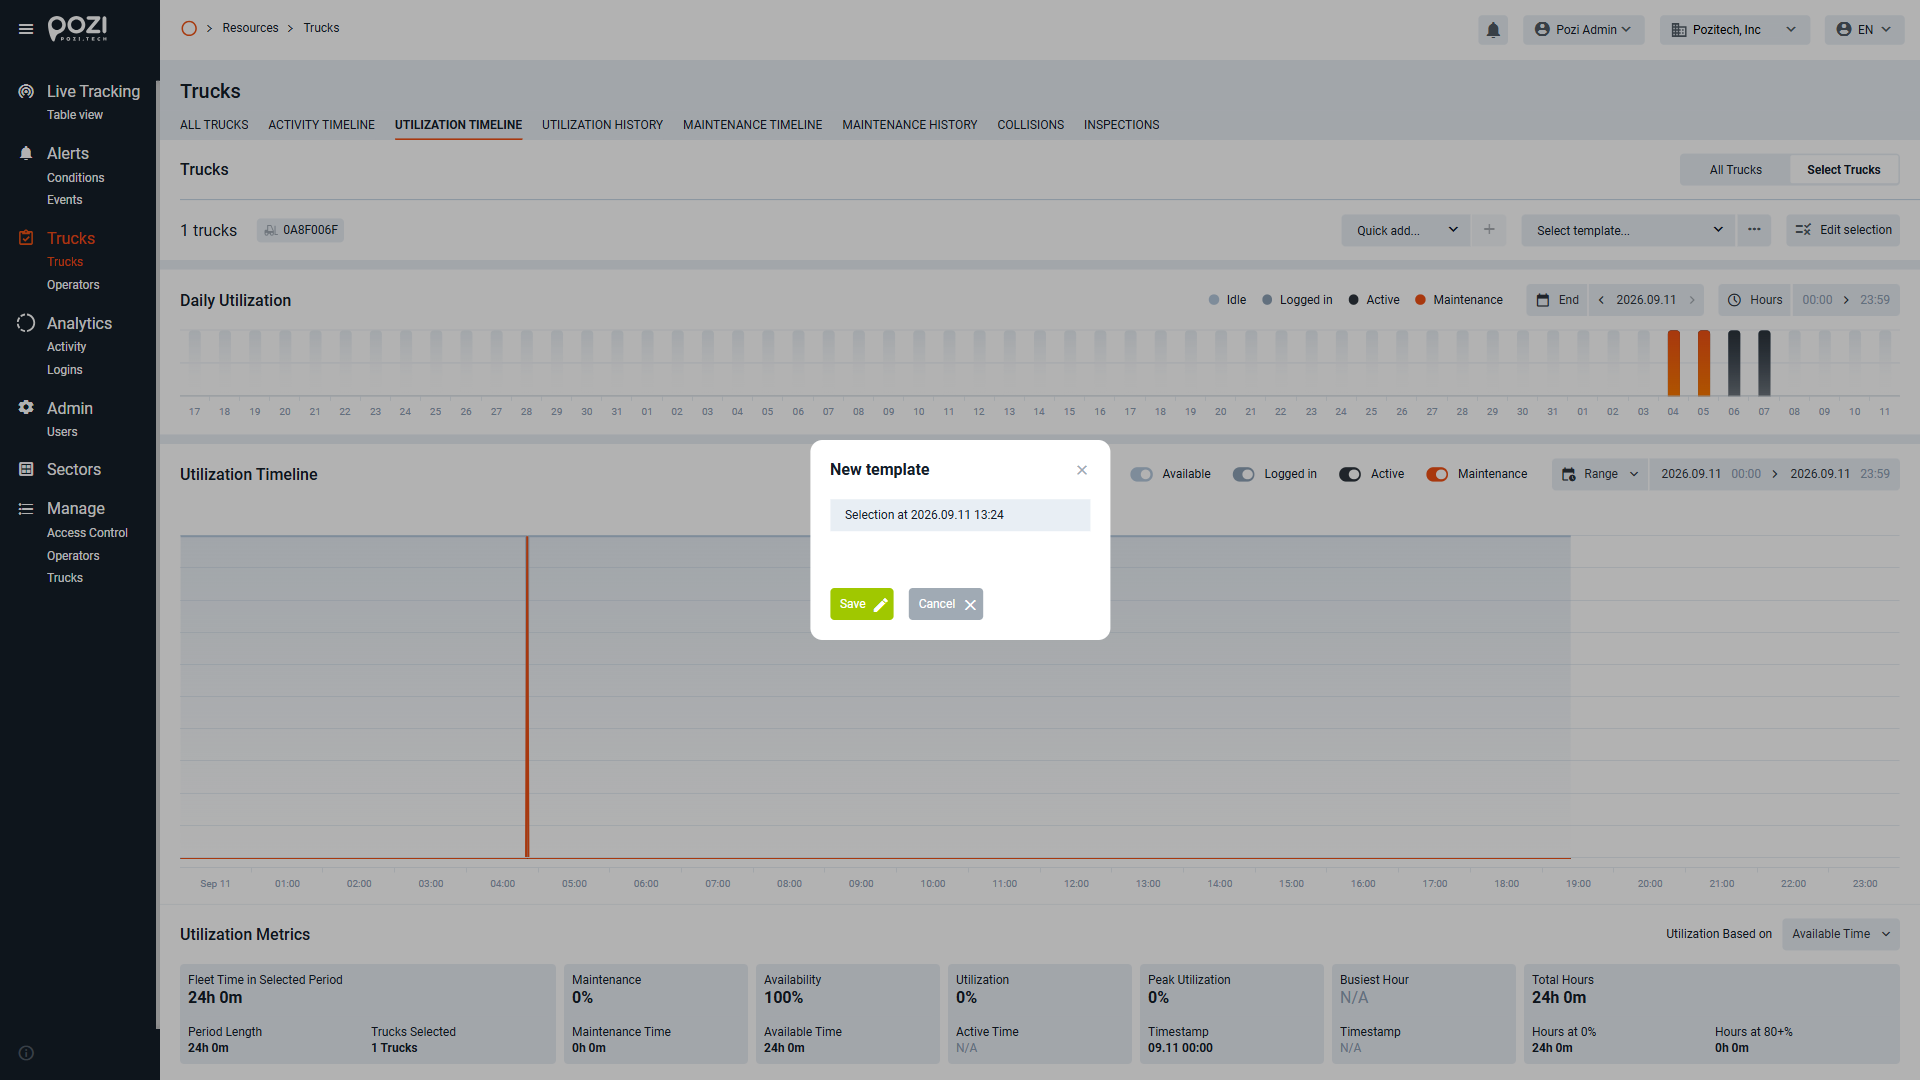
Once you save a template that meets your needs, you can load it anytime, significantly simplifying data collection tasks.
Operators
Operators Submenu
The Operators submenu contains two pages:
- All operators
- Collisions
The default page is All operators.
All Operators
This table allows you to search for operators registered in the SmarTruck system. Key information displayed includes:
- Operator names
- Shifts (most recent and cumulative)
- Logged-in time
- Movement time
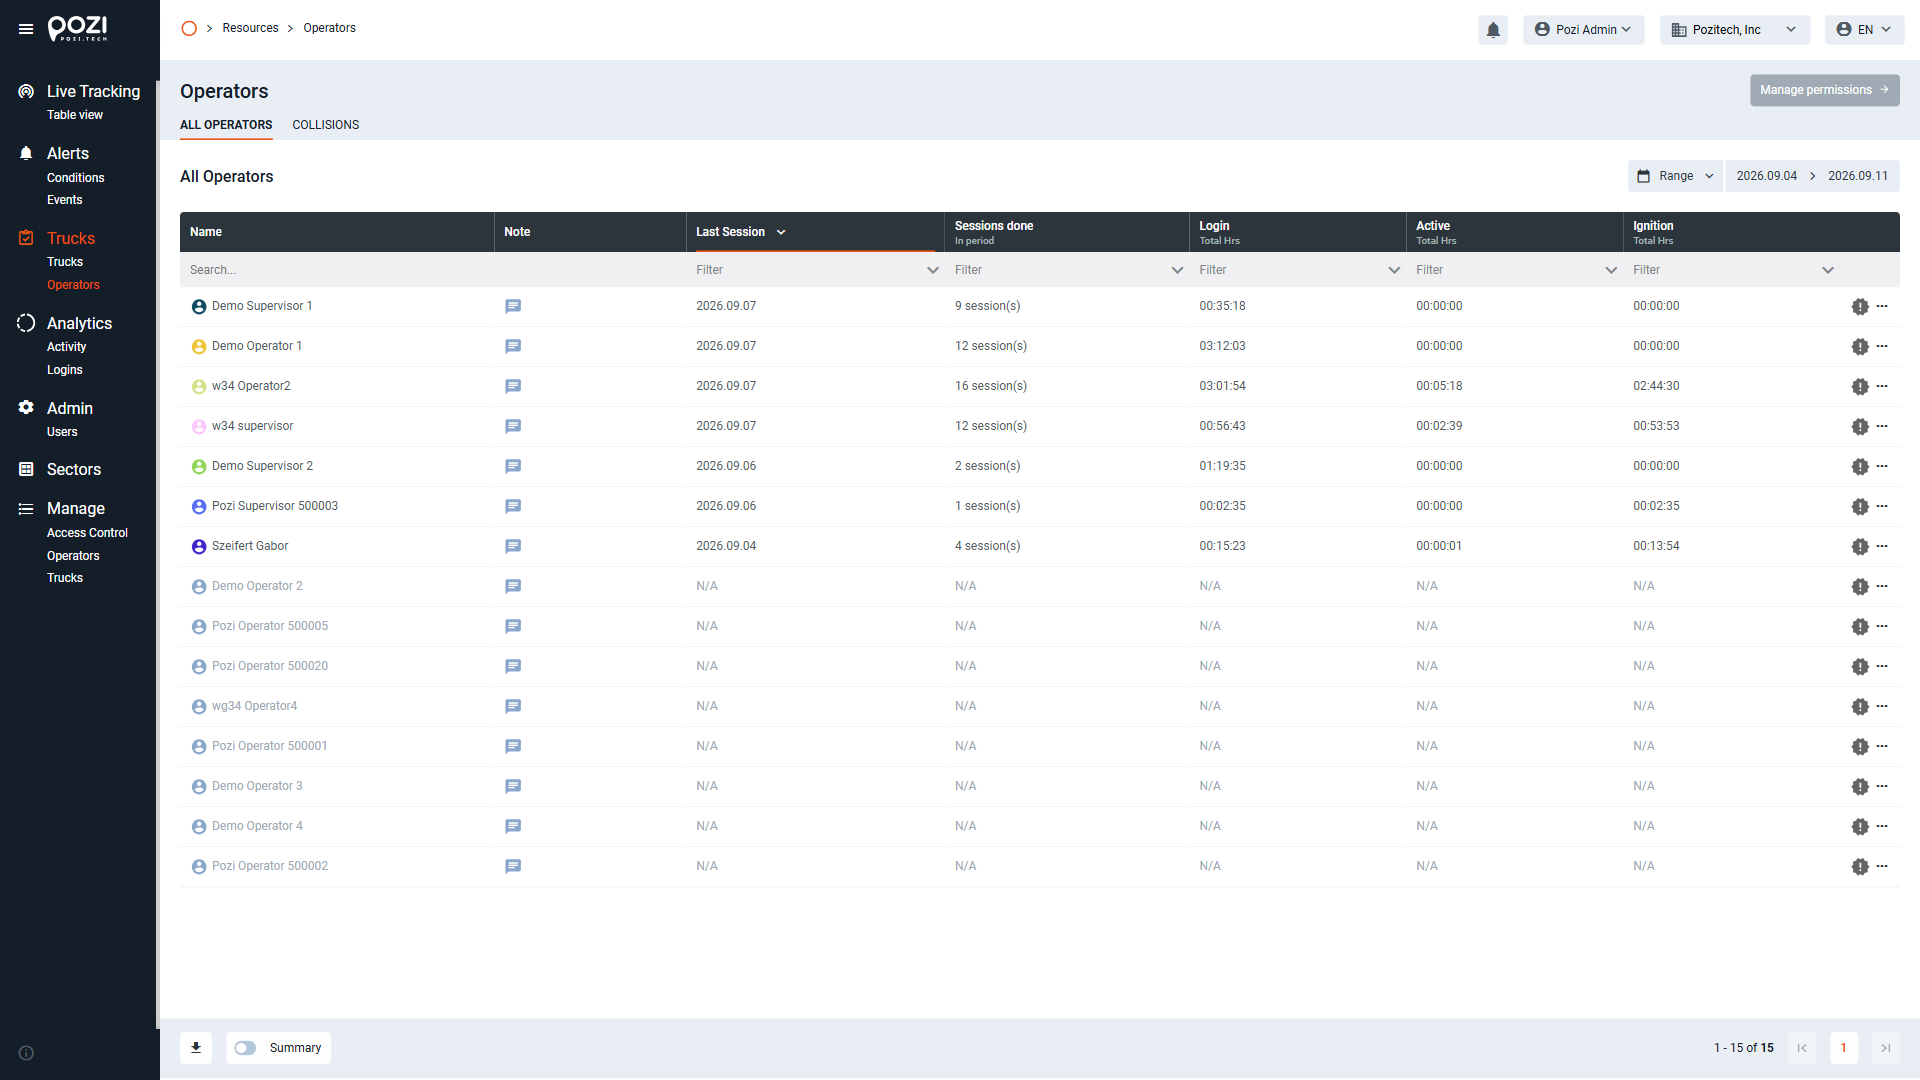
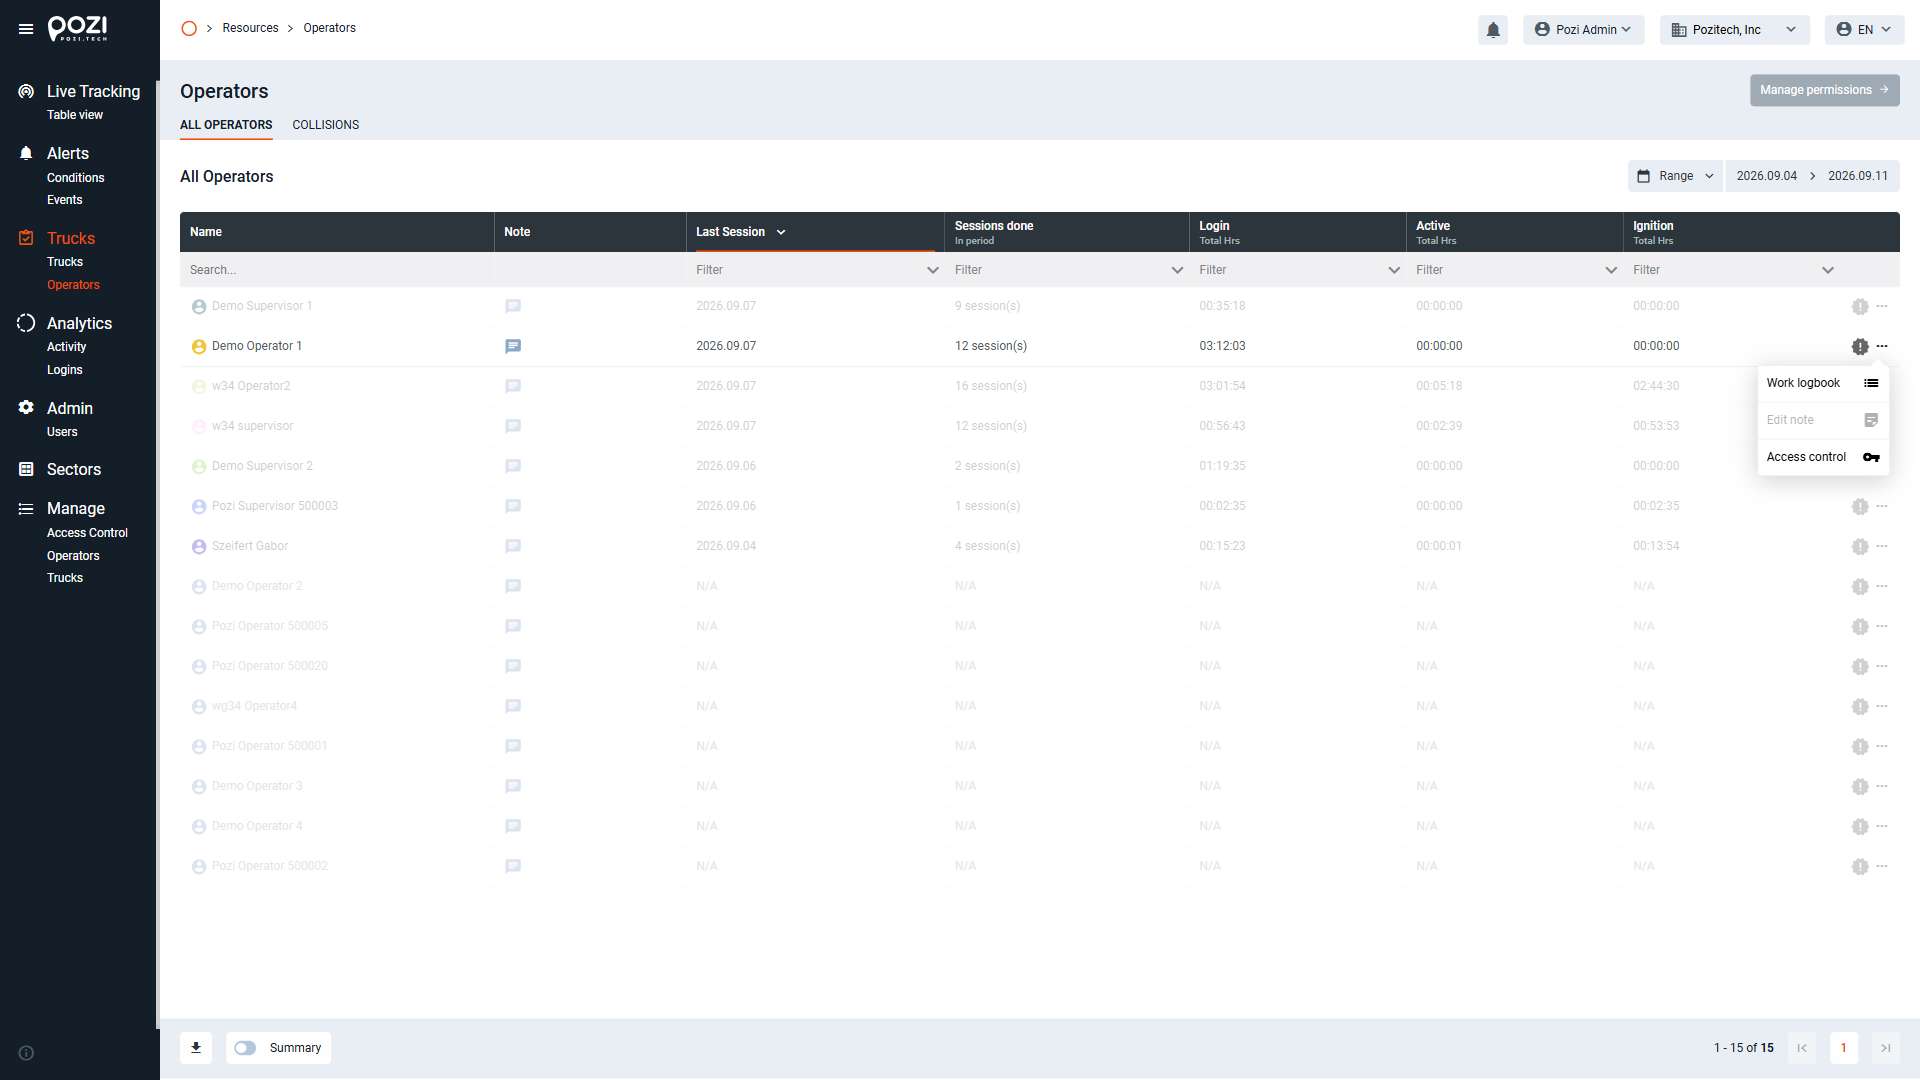
To open an operator’s Work Logbook, click their name. Alternatively, use the … icon at the end of the row to access the Access Control page for that operator.
Collisions
Displays collision events involving operators, sorted by timestamp. This table is also searchable and filterable, like other tables in the system.